
Returns are one of the biggest cost centers in ecommerce. U.S. retail returns hit $849.9 billion in 2025, and online return rates now sit above 20%. Whether you're trying to reduce your return rate, rethink your policy, or just understand how your store compares, these 42 ecommerce return statistics paint the full picture.
Hear what AI support calls sound like for your store. Just paste your Shopify URL and get sample calls in under 20 seconds, no email required. Listen to demo calls for my store.
Key highlights
- U.S. retail returns totaled $849.9 billion in 2025, or 15.8% of all sales (NRF)
- The average ecommerce return rate is now 20.8%, compared to 8.72% in physical stores (Capital One Shopping)
- 82% of consumers say free returns are an important factor when deciding where to shop (NRF & Happy Returns)
- Return fraud costs retailers over $100 billion per year (WiserReview)
- Each return costs retailers between $10 and $65 to process (WiserReview)
- 9.5 billion pounds of returned goods end up in U.S. landfills annually (Optoro)
Overall ecommerce return statistics
1. U.S. retail returns totaled $849.9 billion in 2025, representing 15.8% of annual sales. That's down slightly from $890 billion (16.9%) in 2024, but the number is still staggering. (NRF)
2. The average ecommerce return rate is 20.8% in 2026. Projections range from 20.4% to 24.5% depending on the source and product mix. Either way, roughly one in five online orders gets sent back. (Capital One Shopping)
3. Brick-and-mortar return rates sit at just 8.72%. Online stores deal with returns at more than double the rate of physical retail. The inability to touch, try on, or inspect products before buying is the main driver. (Capital One Shopping)
4. Global ecommerce returns exceed $640 billion annually. That's roughly the GDP of a mid-size country, just in returned products. (Gitnux)
5. Online return rates increased 39.2% from 2023 to 2024. Returns aren't just growing. They're accelerating. (NRF)
The gap between online and in-store return rates isn't closing. As ecommerce keeps growing as a share of total retail, expect the dollar value of returns to keep climbing too. If you sell on Shopify, your ecommerce customer service team is likely spending a big chunk of their time on return-related questions.
Ecommerce return statistics by product category
6. Apparel return rates range from 20% to 30%, with some segments hitting 50%. Fashion is the most returned category in ecommerce by a wide margin, driven by fit uncertainty and bracketing behavior. (Mailmodo)
7. 26% of U.S. consumers returned clothing purchased online in 2025. That's the highest rate among all retail categories. If you run a fashion and apparel store, returns are built into your business model. (Capital One Shopping)
8. Footwear has a return rate of 18%. Shoes are the second most returned category, mostly because sizing varies so much between brands. (Synctrack)
9. Electronics and cosmetics average an 11% return rate online. Standardized specs and hygiene restrictions help keep these numbers lower. (Mailmodo)
10. Home goods and furniture return rates fall in the 15-20% range. Size and color mismatches between the screen and the living room are the usual culprits. (Red Stag Fulfillment)
11. Beauty and skincare products have return rates of just 4-10%. Hygiene concerns and sample programs keep returns low in this category. Good news if you run a cosmetics and skincare store. (Red Stag Fulfillment)
| Category | Average return rate |
|---|---|
| Apparel | 20-30% |
| Footwear | 18% |
| Home goods & furniture | 15-20% |
| Accessories | 12% |
| Electronics | 8-11% |
| Beauty & skincare | 4-10% |
Your category matters a lot when benchmarking. A 15% return rate is great for clothing but concerning for electronics.
Why customers return products
12. Sizing, fit, and color issues account for 45% of all retail returns. Nearly half of all returns come down to the product not matching what the customer expected. Better size guides and product photography can help reduce this. (Mailmodo)
13. 16% of returns happen because the product arrived damaged. This is a fulfillment and packaging problem, not a product problem. (Mailmodo)
14. 14% of returns are caused by inaccurate item descriptions. If your product page says one thing and the customer receives another, the return is on you. (Mailmodo)
15. 63% of consumers admit to bracketing. That means buying multiple sizes or variations of the same item with plans to return what doesn't fit. It's become standard shopping behavior, especially in fashion and apparel. (Returnalyze)
16. 30% of online shoppers intentionally overbuy. They order more than they need, knowing some items will go back. Free return policies have normalized this. (ReadyCloud)
Most return reasons point to a gap between what customers expect and what they receive. Investing in better product descriptions, accurate images, and sizing tools prevents returns before they happen. And when returns do happen, customers want fast answers. That's where AI phone support can handle "where's my refund?" calls at scale.
Return fraud statistics
17. Return fraud costs retailers over $100 billion per year. That includes wardrobing, false damage claims, empty box returns, and policy exploitation. (WiserReview)
18. 15.1% of total return volume is fraudulent. About one in every seven returns involves some form of fraud or abuse. (eFulfillment Service)
19. 9% of all returns are confirmed fraudulent, per the NRF. This is a more conservative figure that counts only verified fraud cases, not gray-area abuse. (NRF)
20. Abusive returns surged 64% between January 2024 and May 2025. The problem is getting worse fast. Signifyd's data shows the overall percentage of abusive returns nearly doubled in that timeframe. (Signifyd)
21. 45% of ecommerce consumers have committed some form of return fraud or policy abuse. This includes everything from wearing an item and returning it, to claiming an item never arrived. (Riskified via WiserReview)
22. The average fraudulent return value is $120. Fraudsters tend to target mid-to-high value items where the payout justifies the effort. (eFulfillment Service)
23. 71% of retailers saw increases in overstated quantity of returns. Other growing fraud types include empty box returns (65% increase) and decoy/counterfeit item returns (64% increase). (NRF)
Return fraud is now a board-level issue for many retailers. The challenge is fighting fraud without making honest customers feel like suspects. Stores need better tools for flagging suspicious returns while keeping the customer experience smooth for everyone else.

The cost of processing returns
24. Each return costs retailers between $10 and $65. The exact cost depends on the product type, weight, shipping distance, and whether the item can be resold. (WiserReview)
25. Processing a single return costs 20-65% of the item's original price. For a $50 shirt, that's $10 to $32.50 gone, just on the return. The math gets ugly fast on low-margin products. (Opensend)
26. Return shipping alone costs $8-$12 per item. That's before you add inspection, restocking, and repackaging. (Opensend)
27. The average fully loaded cost of handling a return is $20-$30. This includes transportation, labor, inspection, restocking, and customer support time. (Opensend)
28. Over 30% of returned items cannot be resold as new. Damaged packaging, signs of use, or missing components mean these products get liquidated, donated, or landfilled. (Gitnux)
Returns aren't just a line item. They eat into margins from every angle: shipping, labor, inventory write-downs, and customer support costs. Every return also generates at least one (and often several) support interactions asking about the refund status.
If you're on Shopify and getting flooded with "where's my refund?" calls, Ringly.io can look up order and return status automatically. Try it free for 14 days.
Return policy and consumer expectation statistics
29. 82% of consumers say free returns are important when deciding where to shop. That's up from 76% in 2024. The expectation for free returns keeps growing, even as more retailers start charging. (NRF & Happy Returns)
30. 65.2% of merchants now charge return fees for mail-in returns. The average fee is $9.04. Free returns are becoming the exception, not the rule. (eFulfillment Service)
31. 81% of consumers review the return policy before making a purchase. Your return policy isn't just fine print. It's a conversion factor. (ReturnPrime)
32. 71% of consumers say a bad return experience would stop them from buying again. That's up from 67% in 2024. Returns are now a make-or-break moment for customer retention. (NRF)
33. 76% of first-time customers who have an easy return experience say they'd shop again. A smooth return process turns first-time buyers into repeat customers. (eFulfillment Service)
34. 85% of shoppers expect their refund within one week. But most refunds take 9-10 days from return to completion. That gap creates support tickets. (WiserReview)
35. 51% of merchants now offer an average incentive of $11.28 to encourage exchanges over refunds. Exchanges keep revenue in the business while still solving the customer's problem. (eFulfillment Service)
There's a real tension here. Customers want free, easy returns. But free returns are expensive and encourage overbuying. The winning strategy for most brands is making returns easy (not necessarily free) and using tools like order tracking and proactive communication to reduce the need for them in the first place.
Holiday and seasonal return statistics
36. Consumers returned $181 billion in online purchases between November 1 and December 31, 2025. That's 14% of all holiday purchases and a 10% increase from the year before. (Digital Commerce 360)
37. 20-25% of holiday merchandise sold is ultimately returned. The holiday return rate runs significantly higher than the annual average. Gift buying, impulse purchases, and heavy discounting all contribute. (Cross-Border Magazine)
38. Peak-season return requests can exceed typical daily volume by 3-5x. January is consistently the busiest month for returns. Your support team needs to be ready. (eDesk)
39. Retailers expect 17% of holiday sales to be returned. That's been consistent year over year. It's a predictable cost you should plan for. (NRF)
The January returns surge is when support teams feel the most pain. Call volume spikes, wait times go up, and customer satisfaction drops. This is exactly the use case where AI voice agents shine. They can handle the flood of "I need to return this gift" and "where's my refund?" calls without hiring seasonal staff. See how it works for your store.
Environmental impact of ecommerce returns
40. 24 million metric tons of CO2 are generated by ecommerce returns each year. Returns aren't just a financial problem. They're an environmental one. (Optoro via CleanHub)
41. 9.5 billion pounds of returned goods end up in U.S. landfills annually. Many retailers find it cheaper to trash returned items than to inspect, repackage, and resell them. (Optoro)
42. Return shipments generate approximately 30% more emissions than the initial delivery. The reverse logistics chain is less optimized than the outbound one, leading to more stops, more miles, and more carbon. (CleanHub)
The environmental cost of returns is becoming a bigger part of the conversation. Consumers increasingly care about sustainability, and brands that reduce their return rates can market that as a competitive advantage. Pairing better product information with strong ecommerce personalization helps customers buy right the first time.
What this means for ecommerce brands
The data is clear. Returns are getting more expensive, more frequent, and more complicated. At $849.9 billion in 2025, they represent one of the single largest costs in retail. And for online stores with return rates above 20%, returns aren't a side issue. They're a core operational challenge that touches ecommerce analytics, support, and fulfillment.
The good news is that many returns are preventable. Nearly half of all returns come from sizing and fit problems, which means better product descriptions, accurate photos, and conversion rate optimization tools like size recommenders can make a real dent. And with 63% of shoppers admitting to bracketing, offering virtual try-on or better product comparison features could reduce the number of items ordered with the intent to return.
But even with the best prevention efforts, returns will happen. And when they do, they generate support volume. Customers call to ask how to initiate a return, check on their refund status, or get help with an exchange. These are repetitive, high-volume calls that follow the same ecommerce trends year after year. They don't require human judgment. They just need fast, accurate answers.
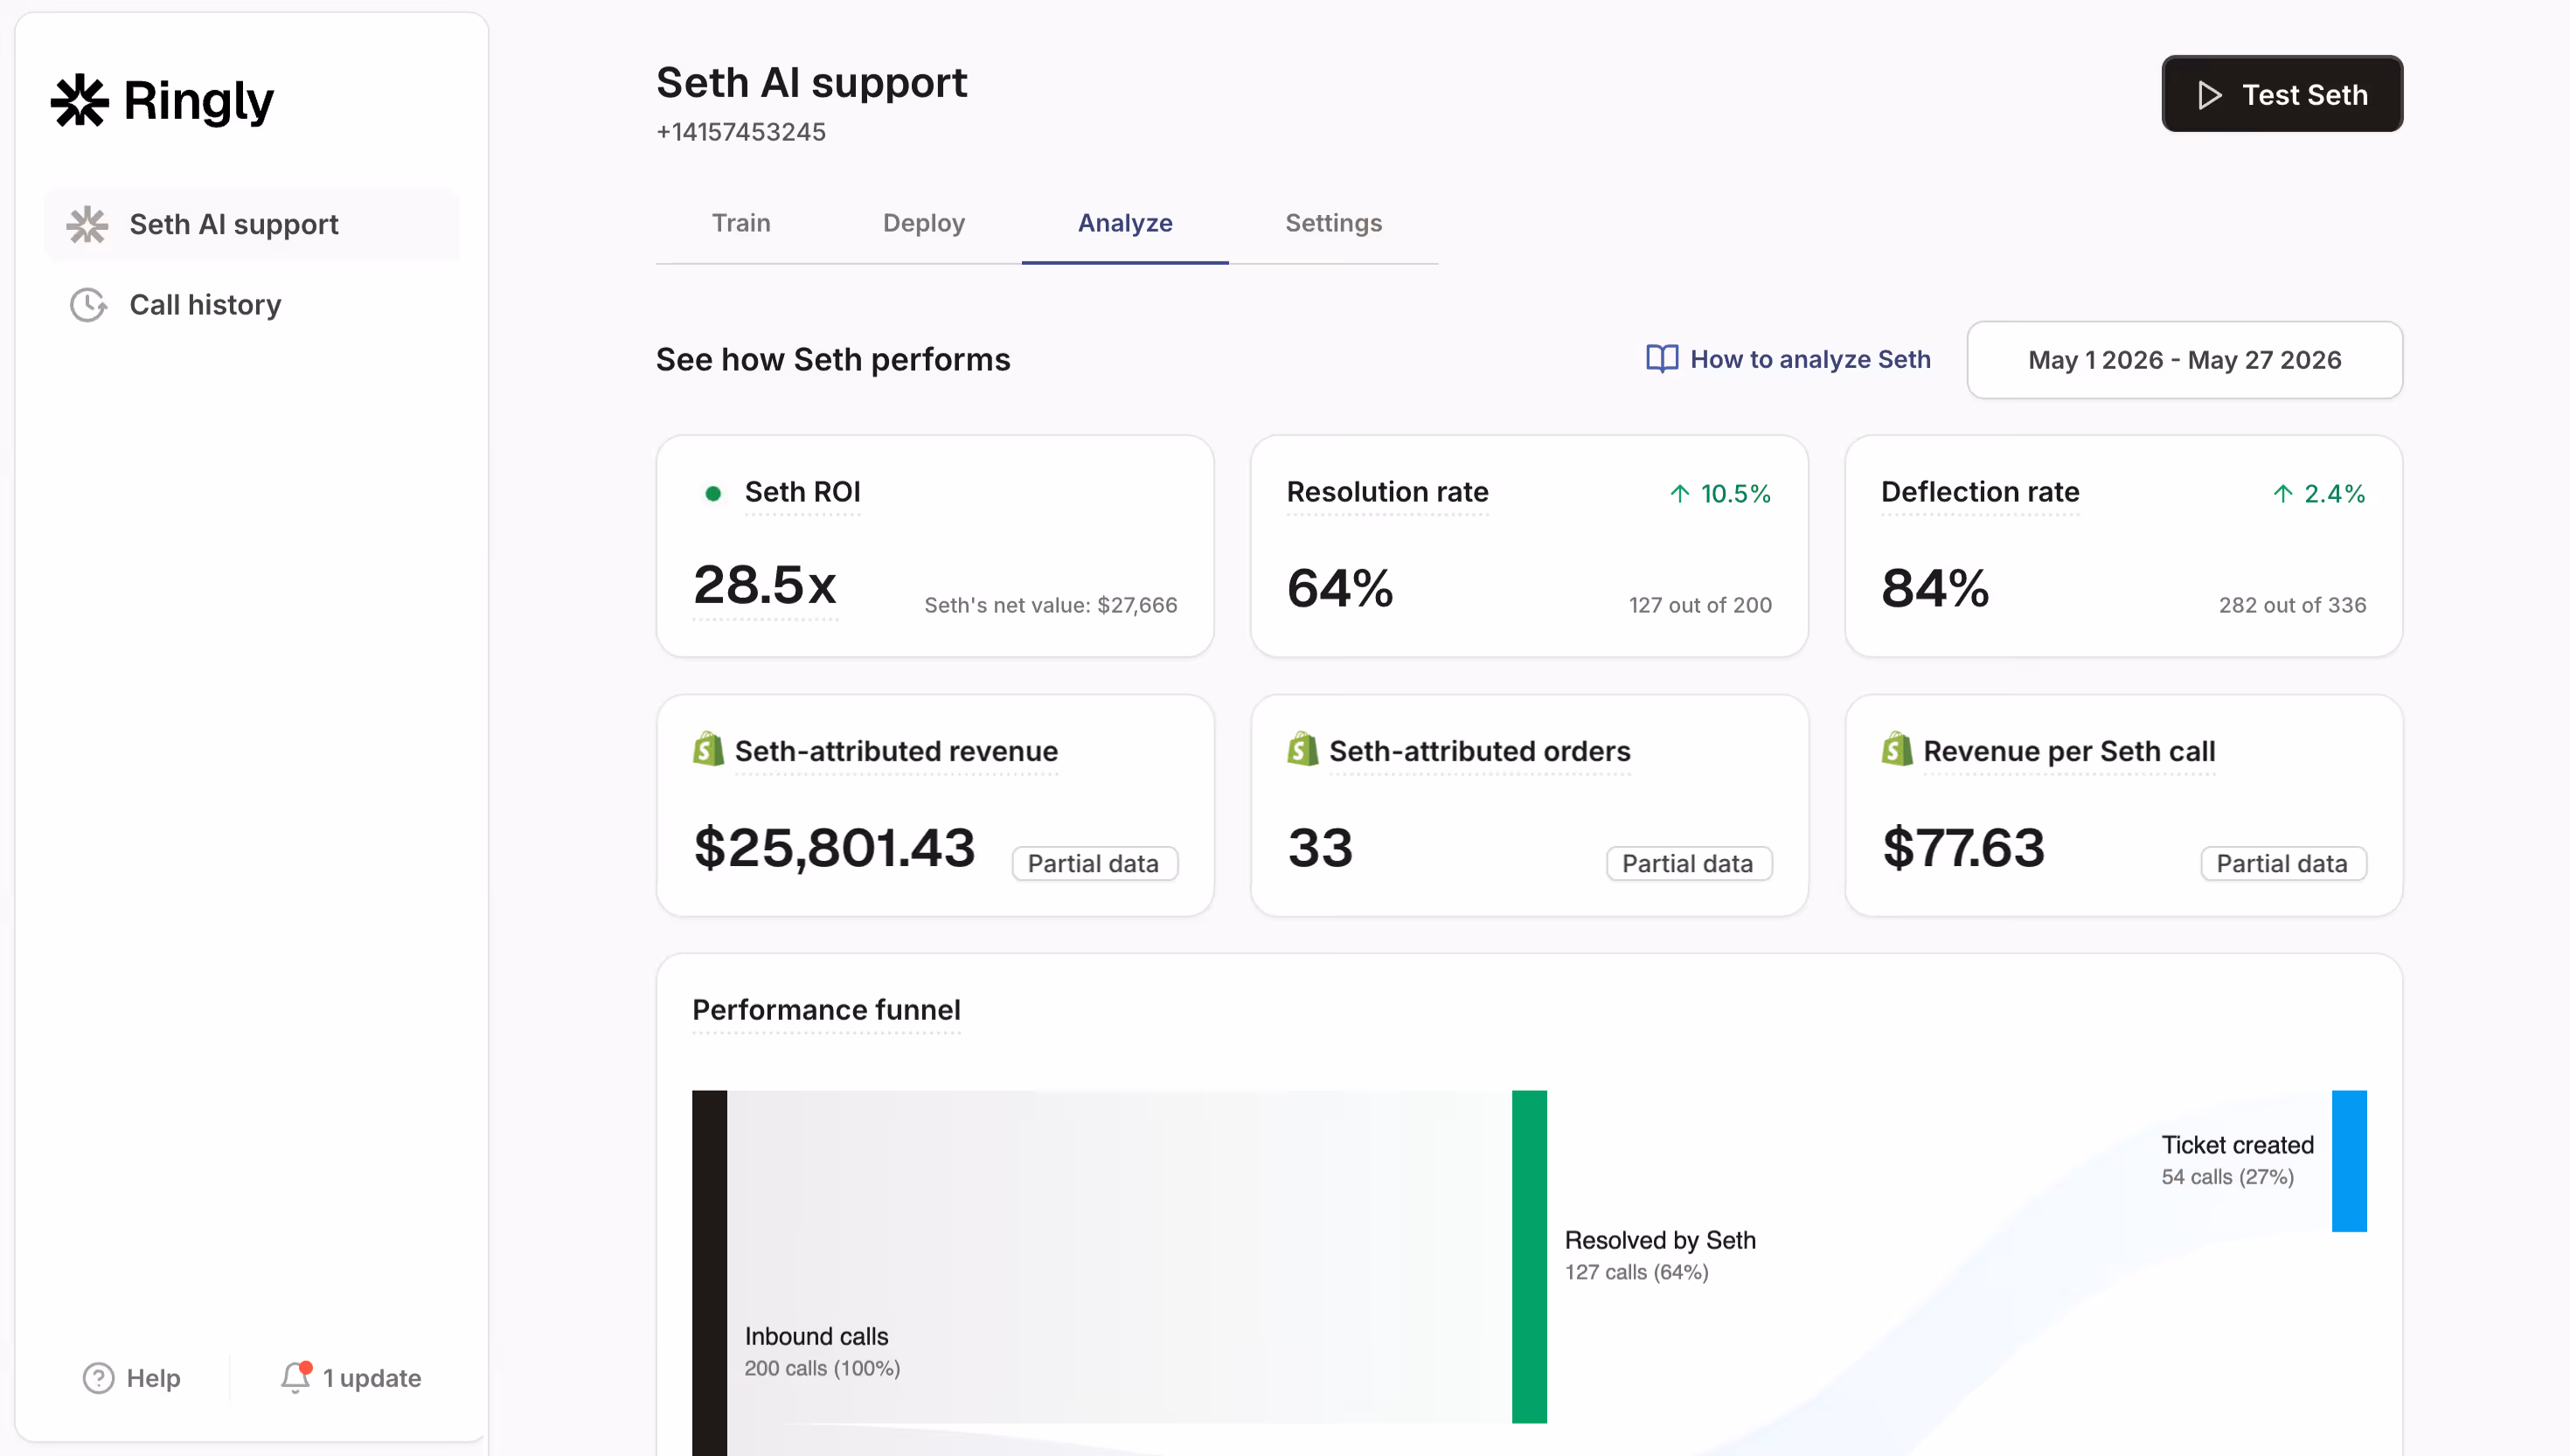
That's where AI phone support fits in. If you run a Shopify store, Ringly.io handles return and WISMO calls automatically by looking up order status, explaining your return policy, and guiding customers through the process. It resolves about 73% of calls without needing a human. Try it free for 14 days and see what it looks like for your store.
Frequently asked questions
What is the average ecommerce return rate in 2026?
The average ecommerce return rate in 2026 is approximately 20.8%, with projections ranging from 20.4% to 24.5% depending on the product category. This is roughly 2-3 times higher than the brick-and-mortar return rate of 8.72%.
How much do returns cost retailers each year?
U.S. retail returns totaled $849.9 billion in 2025. On a per-item basis, processing a single return costs between $10 and $65, factoring in shipping, labor, inspection, and restocking.
What product category has the highest return rate?
Apparel has the highest return rate at 20-30%, with some fashion segments seeing returns as high as 50%. Footwear comes in second at around 18%. Beauty and skincare have the lowest rates at 4-10%.
Why do customers return online purchases?
Sizing, fit, and color issues cause 45% of all returns. Product damage accounts for 16%, and inaccurate descriptions cause 14%. Bracketing (buying multiple sizes to return the ones that don't fit) is now practiced by 63% of consumers.
How common is return fraud?
Return fraud costs retailers over $100 billion per year. About 15.1% of total return volume involves some form of fraud or abuse, and 45% of consumers admit to having committed return fraud at some point.
Are free returns going away?
Increasingly, yes. As of early 2026, 65.2% of merchants charge return fees for mail-in returns, with the average fee at $9.04. But 82% of consumers still say free returns matter when choosing where to shop, so it's a balancing act.
How do returns affect customer loyalty?
Returns have a huge impact on loyalty. 71% of consumers say a bad return experience would stop them from shopping with a retailer again. On the flip side, 76% of first-time customers who have a smooth return say they'd come back.
What is the environmental impact of ecommerce returns?
Ecommerce returns generate 24 million metric tons of CO2 per year, and 9.5 billion pounds of returned goods end up in U.S. landfills annually. Return shipments produce about 30% more emissions than the original delivery.