
Most teams chase delight. The data has been clear for a decade now: low-effort experiences predict loyalty better than wow moments do. Customer effort score (CES) is the metric most likely to tell you whether someone will buy from you again, and it's the one most teams still under-invest in.
Hear what AI support calls sound like for your store. Just paste your Shopify URL and get sample calls in under 20 seconds, no email required. Listen to demo calls for my store.
Key highlights
- 96% of customers with a high-effort interaction become more disloyal. Only 9% with low-effort ones do.
- CES is 1.8x more predictive of loyalty than CSAT and 2x more predictive than NPS.
- 62% of channel switches are rated "high effort" by customers.
- 74% of customers find it frustrating to retell their story to a new agent.
- A low-effort interaction costs 37% less than a high-effort one to deliver.
- 60% of service teams now track CES, up from 44% in 2018.
CES benchmarks by industry in 2026
If you don't know what "good" looks like, here's the floor and ceiling.
A good customer effort score sits above 80% on a percentage scale. Gartner's benchmarking shows that scores below 70% indicate a clear need for improvement, while anything above 90% means you're running a strong, low-effort operation. (Source)
Ecommerce and retail typically score 82-90% on CES. Straightforward transactions (one product, one checkout, one delivery) keep scores high. B2B enterprise support is the opposite, usually landing 65-75%. (Source)
Electronics ecommerce averages 5.1 out of 7 on the standard CES scale; fashion averages 5.4. That's a real spread across categories you'd think were similar. Electronics customers ask harder questions. (Source)
SaaS and tech companies should target 85-90% positive ratings. Onboarding is the make-or-break moment. If a new user has to email support to figure out how your product works, your CES is already broken. (Source)
Retail averages 78% first-call resolution, the highest of any industry. FCR and CES move together. Resolving on the first try is the cheapest, fastest way to lower effort. (Source)
The industry average call center FCR is 71%, with strong performance landing 70-79%. If you're under 70%, customers are calling back. Calling back is the highest-effort outcome there is. (Source)
A 1-point CES improvement can boost retention by up to 8% in ecommerce. Small movements on the score show up immediately in repeat purchase behavior. (Source)
The benchmark to remember: ecommerce should be at 80%+ on CES. If you're below that, the leak is bigger than your marketing budget can patch. For more context on tracking these alongside other support metrics, see our customer service KPIs guide for ecommerce.
Effort and customer loyalty (the Gartner findings)
This is the foundational research that put CES on the map. It's still the most-cited body of work in customer experience.
94% of customers with a low-effort interaction intend to repurchase. Compared to just 4% of those with high-effort interactions. That's a 23x gap on a single metric. (Source)
88% of low-effort customers intend to increase their spending. Effort isn't just about retention. It's about wallet share. People who get help easily buy more from you. (Source)
Only 1% of low-effort customers say something negative about you to others. Compare that to the 81% of high-effort customers who tell a negative story. Word-of-mouth is downstream of effort. (Source)
A low-effort interaction costs 37% less to deliver. Less escalation, less hold time, less rework. The cheap path and the loyal path are the same path. (Source)
Repeat customers generate ~300% more revenue than first-time buyers. Effort feeds repeat purchase. Repeat purchase feeds revenue. The math compounds. (Source)
The average ecommerce repeat customer rate sits 25-30%; Shopify stores average 27%. Effort is the single biggest lever pushing that number up or down. See more in our ecommerce customer retention guide. (Source)
The CEB / Gartner studies pulled from 97,000+ customer responses and 100+ companies. This isn't a small-sample fluke. The pattern repeats every time someone re-runs the work.
Effort and churn (high effort = high churn)
The mirror image of the loyalty data. Same numbers, harder to read.
96% of customers with a high-effort experience become more disloyal. Versus 9% of low-effort ones. This single stat is the entire reason CES exists as a metric. (Source)
More than half of consumers will switch to a competitor after one bad experience. Most "bad experiences" aren't catastrophes. They're high-effort moments that compound. (Source)
85% of CX leaders say customers will drop a brand over an unresolved issue, even on first contact. First-contact resolution isn't a nice-to-have anymore. It's the table stake. (Source)
21% of brands declined in CX quality in 2025; only 6% improved. Forrester's CX Index has been showing decline for multiple years. Brands aren't getting easier to deal with. They're getting harder. (Source)
In the US, 25% of brands declined and just 7% improved. Decline is concentrated in markets with the most "AI deflection" investment. The two trends are connected. (Source)
If you want to see what good response speed looks like, our customer service response time benchmarks post breaks down the specific thresholds.
CES vs CSAT vs NPS, what each metric actually predicts
These three are not interchangeable. Picking the wrong one is the most common CX measurement mistake.
CES is 1.8x more predictive of loyalty than CSAT. And 2x more predictive than NPS. Effort is what behavior follows; satisfaction and advocacy are what people say afterward. (Source)
60% of service professionals now track CES, up from 44% in 2018. It's officially one of the top-5 most-measured customer service metrics. The ones not tracking it are mostly tracking metrics with weaker predictive power. (Source)
53% of HubSpot CRM leaders have reduced churn and 75% have increased retention by centralizing feedback (CSAT, NPS, CES) and speeding up resolution. Centralizing matters. Three metrics in three tools is worse than one in one. (Source)
Customers in low-effort interactions are 94% more likely to repurchase and 88% more likely to spend more. That's the same study but worth re-reading: CES out-predicts both NPS and CSAT on the behaviors that matter. (Source)
The standard CES question: "How easy was it to resolve your issue today?" Scored on a 1-7 scale, target above 5.0. Two extra survey lines after a support interaction. That's the whole instrument. (Source)
For a deeper comparison on the advocacy side, see our NPS statistics for 2026 post.
Top causes of customer effort (transfers, repeats, channel switching)
This is where effort actually shows up. Five specific moments destroy CES across nearly every customer journey.
62% of customer service channel switches are rated "high effort." Self-service to chat, chat to phone, phone to email. Almost two out of three handoffs feel hard to the customer. (Source)
88% of journeys that start in self-service touch a live agent. Self-service rarely fully resolves the issue. The handoff is where most effort gets created. (Source)
Only 7% of contact centers can transition customers between channels while preserving context. That's the engineering reason customers have to repeat themselves. The other 93% drop the context on the floor. (Source)
66% of customers get frustrated when they have to repeat information to different staff. Asking the same question twice is the fastest way to spike CES. (Source)
33% of customers rank "repeating yourself to multiple reps" as their #1 frustration. It's the single most-named complaint about modern support. (Source)
74% of customers find it frustrating to retell their story to different agents. Zendesk pulled this from 11,000 consumer interviews in 22 countries. Universal pain. (Source)
~70% of customers are irritated when their call is transferred department to department. Each transfer multiplies the effort tax. (Source)
High call transfer rates reduce first-call resolution by 14%. The two numbers move together. Cut transfers, FCR goes up, CES goes up. (Source)
Customers transferred even once are 2x as likely to leave negative feedback. One handoff doubles your bad-review risk. (Source)
60% of customers say long holds and waits are the most frustrating part of service. Hold time is pure effort. There's no upside to holding for the customer. (Source)
64% of customers will avoid a brand entirely if they had to wait on hold more than 30 minutes. That's a permanent loss, not a one-off complaint. (Source)
71% of customer service employees say switching between channels makes it harder to meet customer needs. When agents say a process is hard, customers feel it twice as hard. (Source)
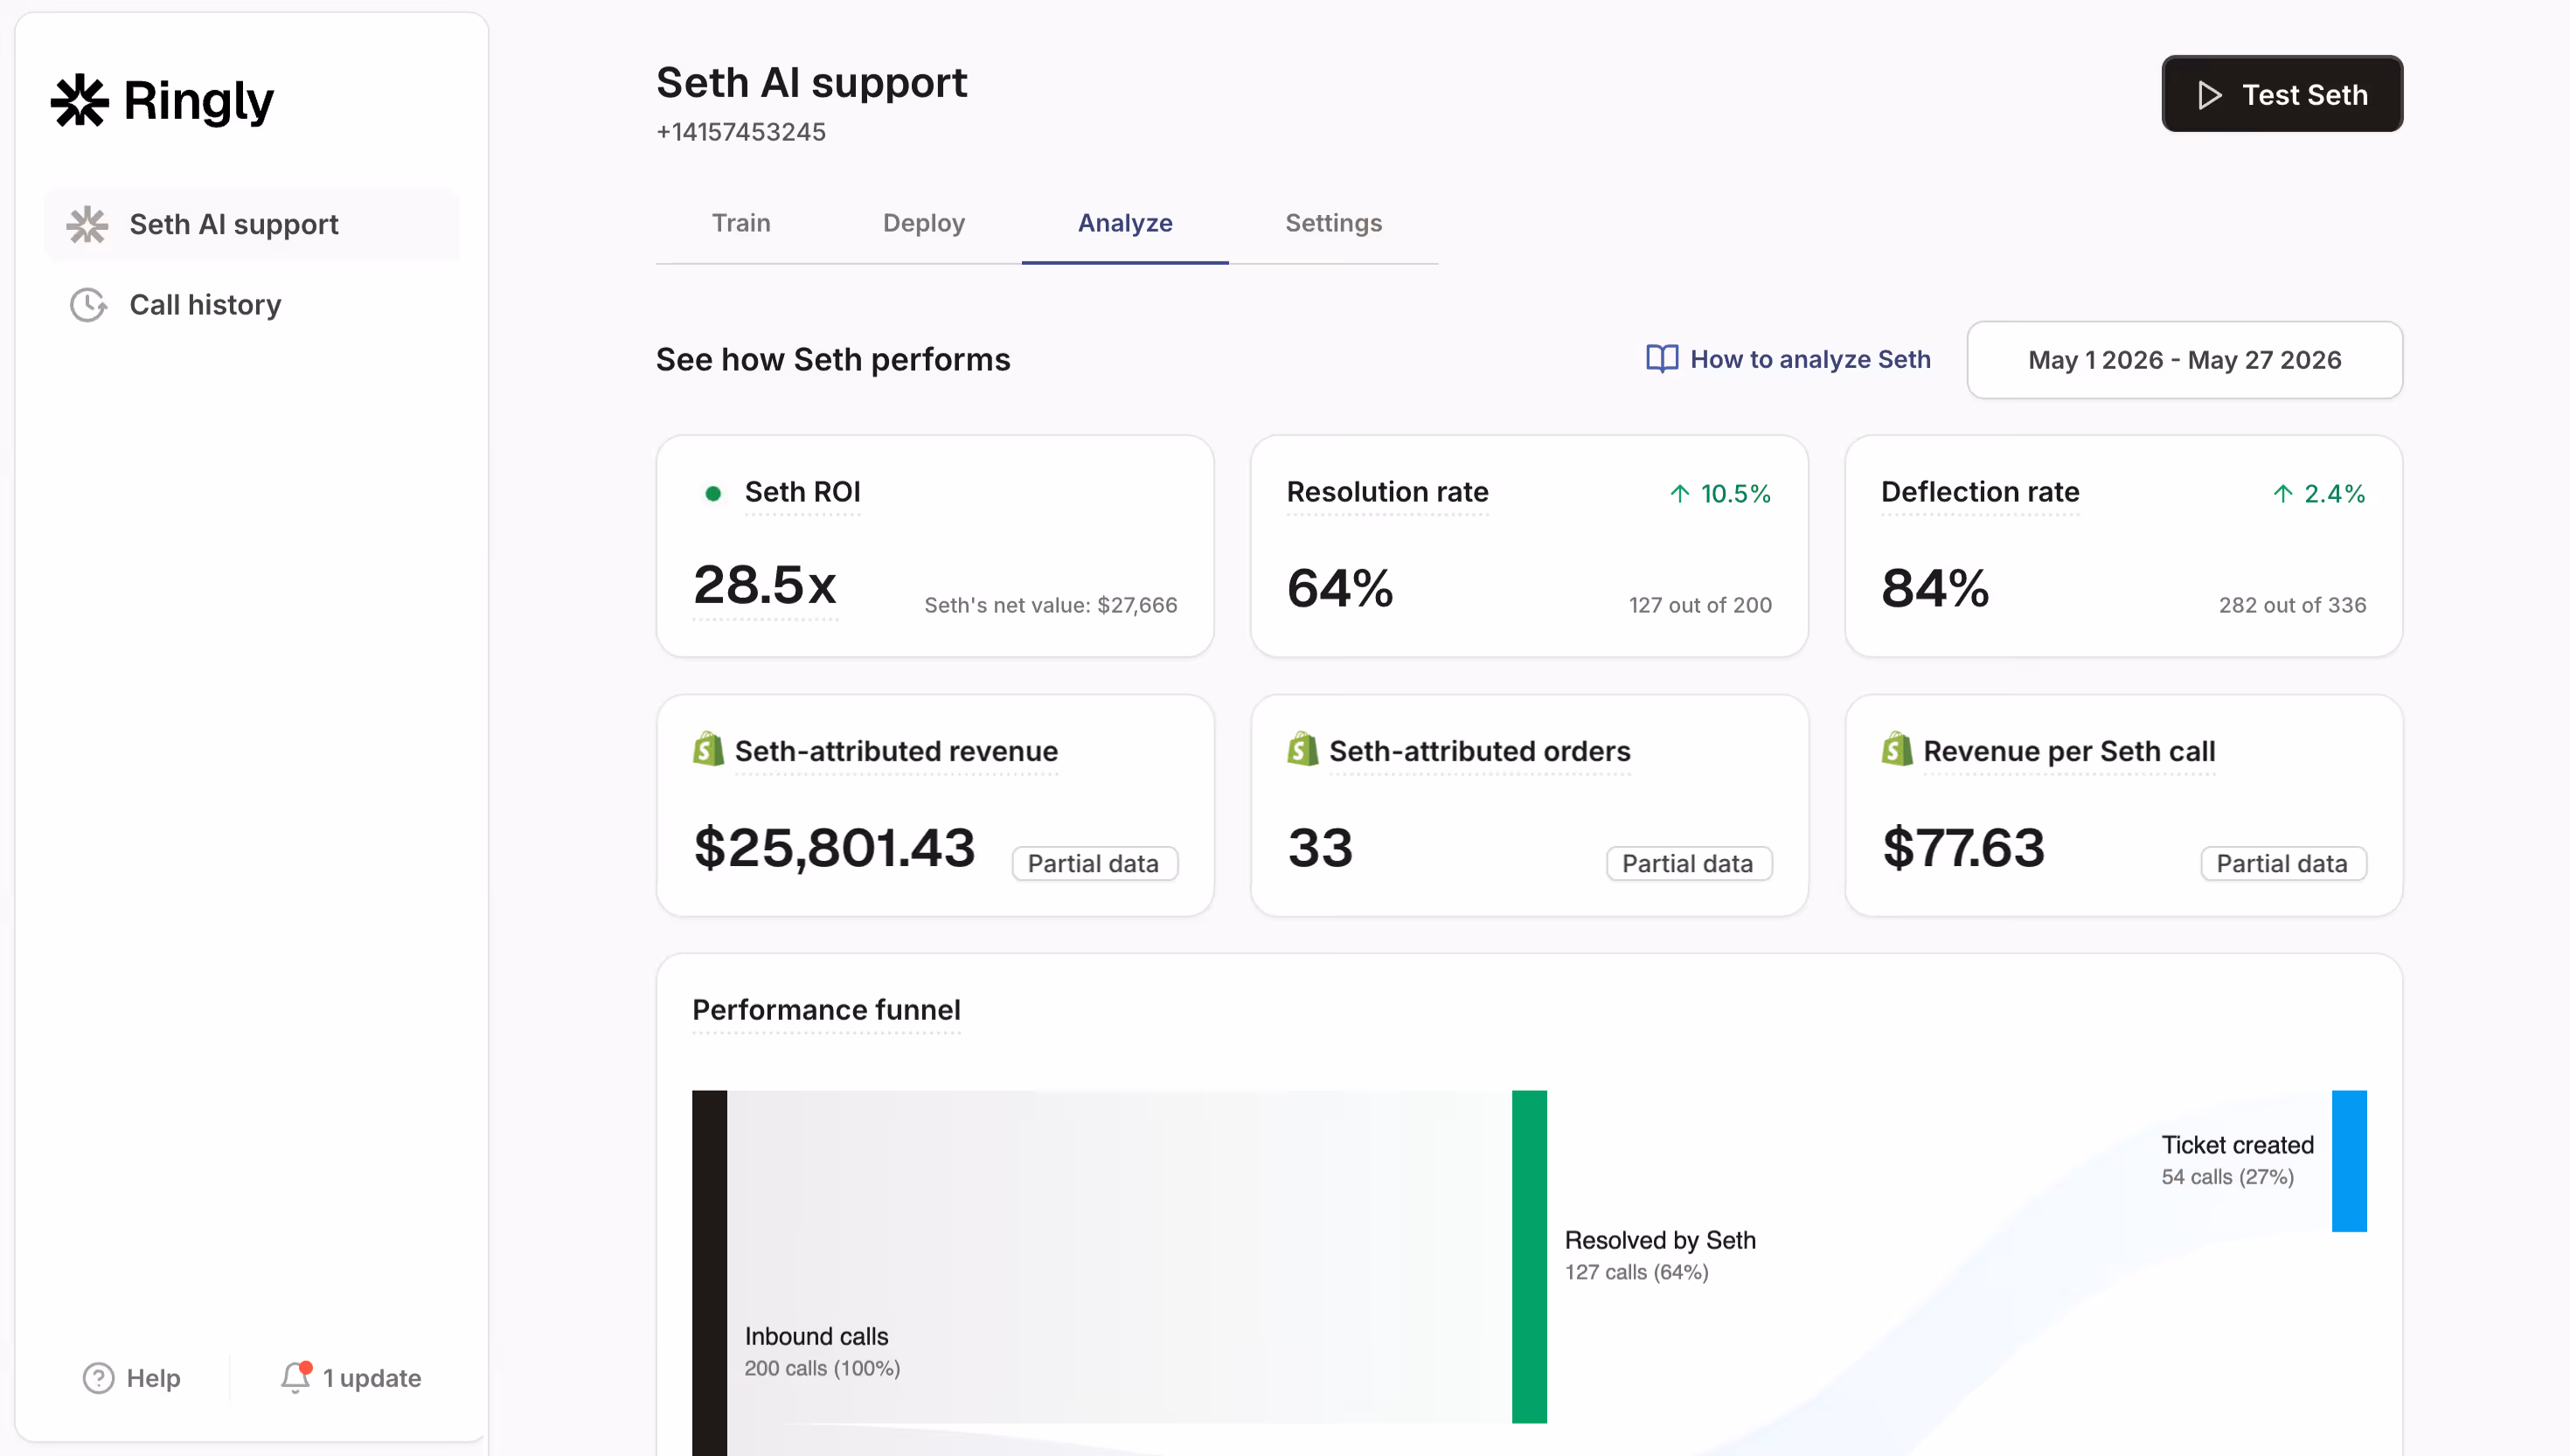
If you run a Shopify store and most of these moments happen on the phone, that's where Seth (our AI voice agent) plugs in. Listen to a sample call for your store.
Self-service and effort reduction
Self-service is supposed to lower effort. The data says it usually doesn't, unless it's done extremely well.
81% of buyers attempt self-service first; only 14% fully resolve their issue without help. The 67-point gap is the entire customer-effort problem in one stat. (Source)
88% of customers want a self-service portal option. Demand is there. Execution isn't. (Source)
60% of support tickets could be resolved with self-service; only 36% currently are. Most companies have built the form, not the answer. (Source)
Live channels cost ~$8.01 per contact; self-service costs ~$0.10. An 80x cost gap. Every ticket you push down to self-service successfully is pure margin recovery. (Source)
77% of customers say a poor self-service option is worse than no support at all. Bad self-service is worse than no self-service. It signals you don't care. (Source)
80% of high-performing service orgs offer self-service vs only 56% of low performers. The performance gap is real, but only if the self-service actually works. (Source)
74% of customers who have an easy transition from self-service to a rep say they'll go back to self-service next time. Get the handoff right and customers happily return to lower-effort channels. (Source)
Less than half of customers who experience a high-effort handoff ever return to self-service. Botch the handoff once and you've trained them to skip self-service forever. (Source)
93% of customers report high CSAT when channel transitions feel smooth. Almost everyone is happy when the experience flows. The bottleneck is operational, not motivational. (Source)
Customers with smooth, well-handed-off transitions spend 27% less time in assisted channels. Less time on the phone with a human. Lower cost, lower effort, both at once. (Source)
For ecommerce-specific tactics on this, our self-service customer support statistics for 2026 post goes deeper on the operational side.
AI's impact on customer effort
This is the area moving fastest in 2026. The numbers are large but uneven.
91% of customer service leaders are under pressure to implement AI in 2026. Boards have made up their minds. The execution is the bottleneck now. (Source)
83% of CX leaders say memory-rich AI is the key to truly personalized journeys. "Memory-rich" means the AI knows the order, the prior tickets, the context. That's what stops customers from repeating themselves. (Source)
88% of customers expect faster response times than they did just a year ago. Expectations move every year. Customers calibrate to the best AI experience, then demand the same speed everywhere. (Source)
74% of consumers now expect 24/7 support. Driven by AI making it possible. Once it's possible, customers stop accepting business hours. (Source)
AI chatbots resolve up to 86% of customer questions without human intervention in mature deployments. Most ecommerce stores land in the 50-70% range. The top end is reachable but takes serious work. (Source)
Conversational AI for customer service is projected to cut contact-center labor costs by $80 billion by 2026. That's the savings target the industry is chasing. (Source)
AI agent-assist tools cut average handle time by 27%. And ServiceNow reported AI agents cutting time-to-handle on complex cases by 52%. (Source)
AI cut first-response times from 6 hours to 4 minutes; resolution times from 32 hours to 32 minutes (87% improvement). That's the gap between "AI on" and "AI off" at organizations measuring carefully. (Source)
72% of agents say AI improves efficiency, but only 42% say it actually reduces time and effort. The 30-point gap is the credibility problem AI vendors haven't solved yet. (Source)
81% of customer service teams still operate AI as disconnected tools. Most "AI implementations" are AI bolted onto a legacy system. The lift on CES happens when AI is integrated end-to-end, not point-solution-grafted. (Source)
95% of consumers want to know why AI made the decisions it did. Transparency reduces effort. Customers will accept an AI denial. They won't accept "computer says no" with no reason. (Source)
For a deeper view of where AI is actually moving the needle, see our AI customer service statistics for 2026 and the voice AI customer support breakdown.
What this means for ecommerce brands
The CES research has been consistent for over a decade now. Reduce effort. The rest follows.
What's changed in 2026 is that the levers to reduce effort have shifted. Self-service used to mean a help center. Now it means an AI that can actually finish the job. Phone support used to mean hold music and transfers. Now it means a voice agent that knows the order, looks it up live, and resolves it on the first call.
For Shopify stores specifically, the biggest moves are the ones that kill the top three effort triggers: hold time, repeating yourself, and channel switching. An AI phone agent for Shopify handles all three. No hold time (24/7 pickup). No repetition (full Shopify context). No channel switching (the call starts and ends on the phone).
If you're tracking CES alongside other metrics like first-call resolution and response time, the pattern is clear: every basis point you take off effort shows up as retention 90 days later.
If you run a Shopify store, Ringly.io handles 73% of support calls automatically. Setup takes 3 minutes and you can try free for 14 days.
Frequently asked questions
What is a good customer effort score in 2026?
A good CES sits above 80% on a percentage scale, or above 5.0 on a 1-7 scale. Gartner's benchmark calls below 70% a clear improvement opportunity and above 90% strong. Ecommerce should target 82-90%.
How is CES calculated?
The standard CES question is "How easy was it to resolve your issue today?" scored on a 1-7 scale (Strongly Disagree to Strongly Agree). Average the scores across respondents. Some companies convert to a percentage by treating responses of 5-7 as positive and reporting that share.
Is CES better than NPS or CSAT?
For predicting loyalty and repeat purchase behavior, yes. Gartner's research shows CES is 1.8x more predictive than CSAT and 2x more predictive than NPS. NPS is still better for advocacy and word-of-mouth. CSAT is better for measuring a single moment.
What's the biggest cause of high customer effort?
Repeating yourself to multiple agents and channel switching. 74% of customers find it frustrating to retell their story, and 62% of channel transitions are rated high-effort. Hold time and transfers compound from there.
How does AI reduce customer effort?
By eliminating the highest-effort moments: hold time, repetition, and channel switching. AI agents can answer 24/7, hold customer context across interactions, and resolve issues on the first contact. Mature deployments resolve 70-86% of questions without human intervention.
Does CES correlate with revenue?
Yes. 94% of low-effort customers intend to repurchase vs 4% of high-effort, and 88% intend to spend more. McKinsey found that companies with top-quartile CX outperform peers by ~80% in revenue growth.
What's the cheapest way to lower CES?
Stop transferring people. Cutting transfers raises first-call resolution by ~14%, lowers CES, and costs nothing in software. After that, the next-cheapest move is connecting your help center, chat, and phone to the same customer record so people don't repeat themselves.
Should ecommerce stores use a phone CES survey?
Yes, especially after returns, refund issues, and order problems. Phone interactions are where the highest-effort moments live (hold time, transfers, repeating yourself). A two-question post-call CES survey catches issues that chat and email surveys miss.