
Ecommerce analytics is how you turn raw data into revenue growth.
Without it, you're making decisions based on gut feelings while your competitors are making them based on facts.
Here's the short version: ecommerce analytics tracks what happens in your online store, helps you understand why it happens, and shows you what to do next.
When done right, it reveals which marketing channels actually convert, which products drive profit, and where customers get stuck before buying.
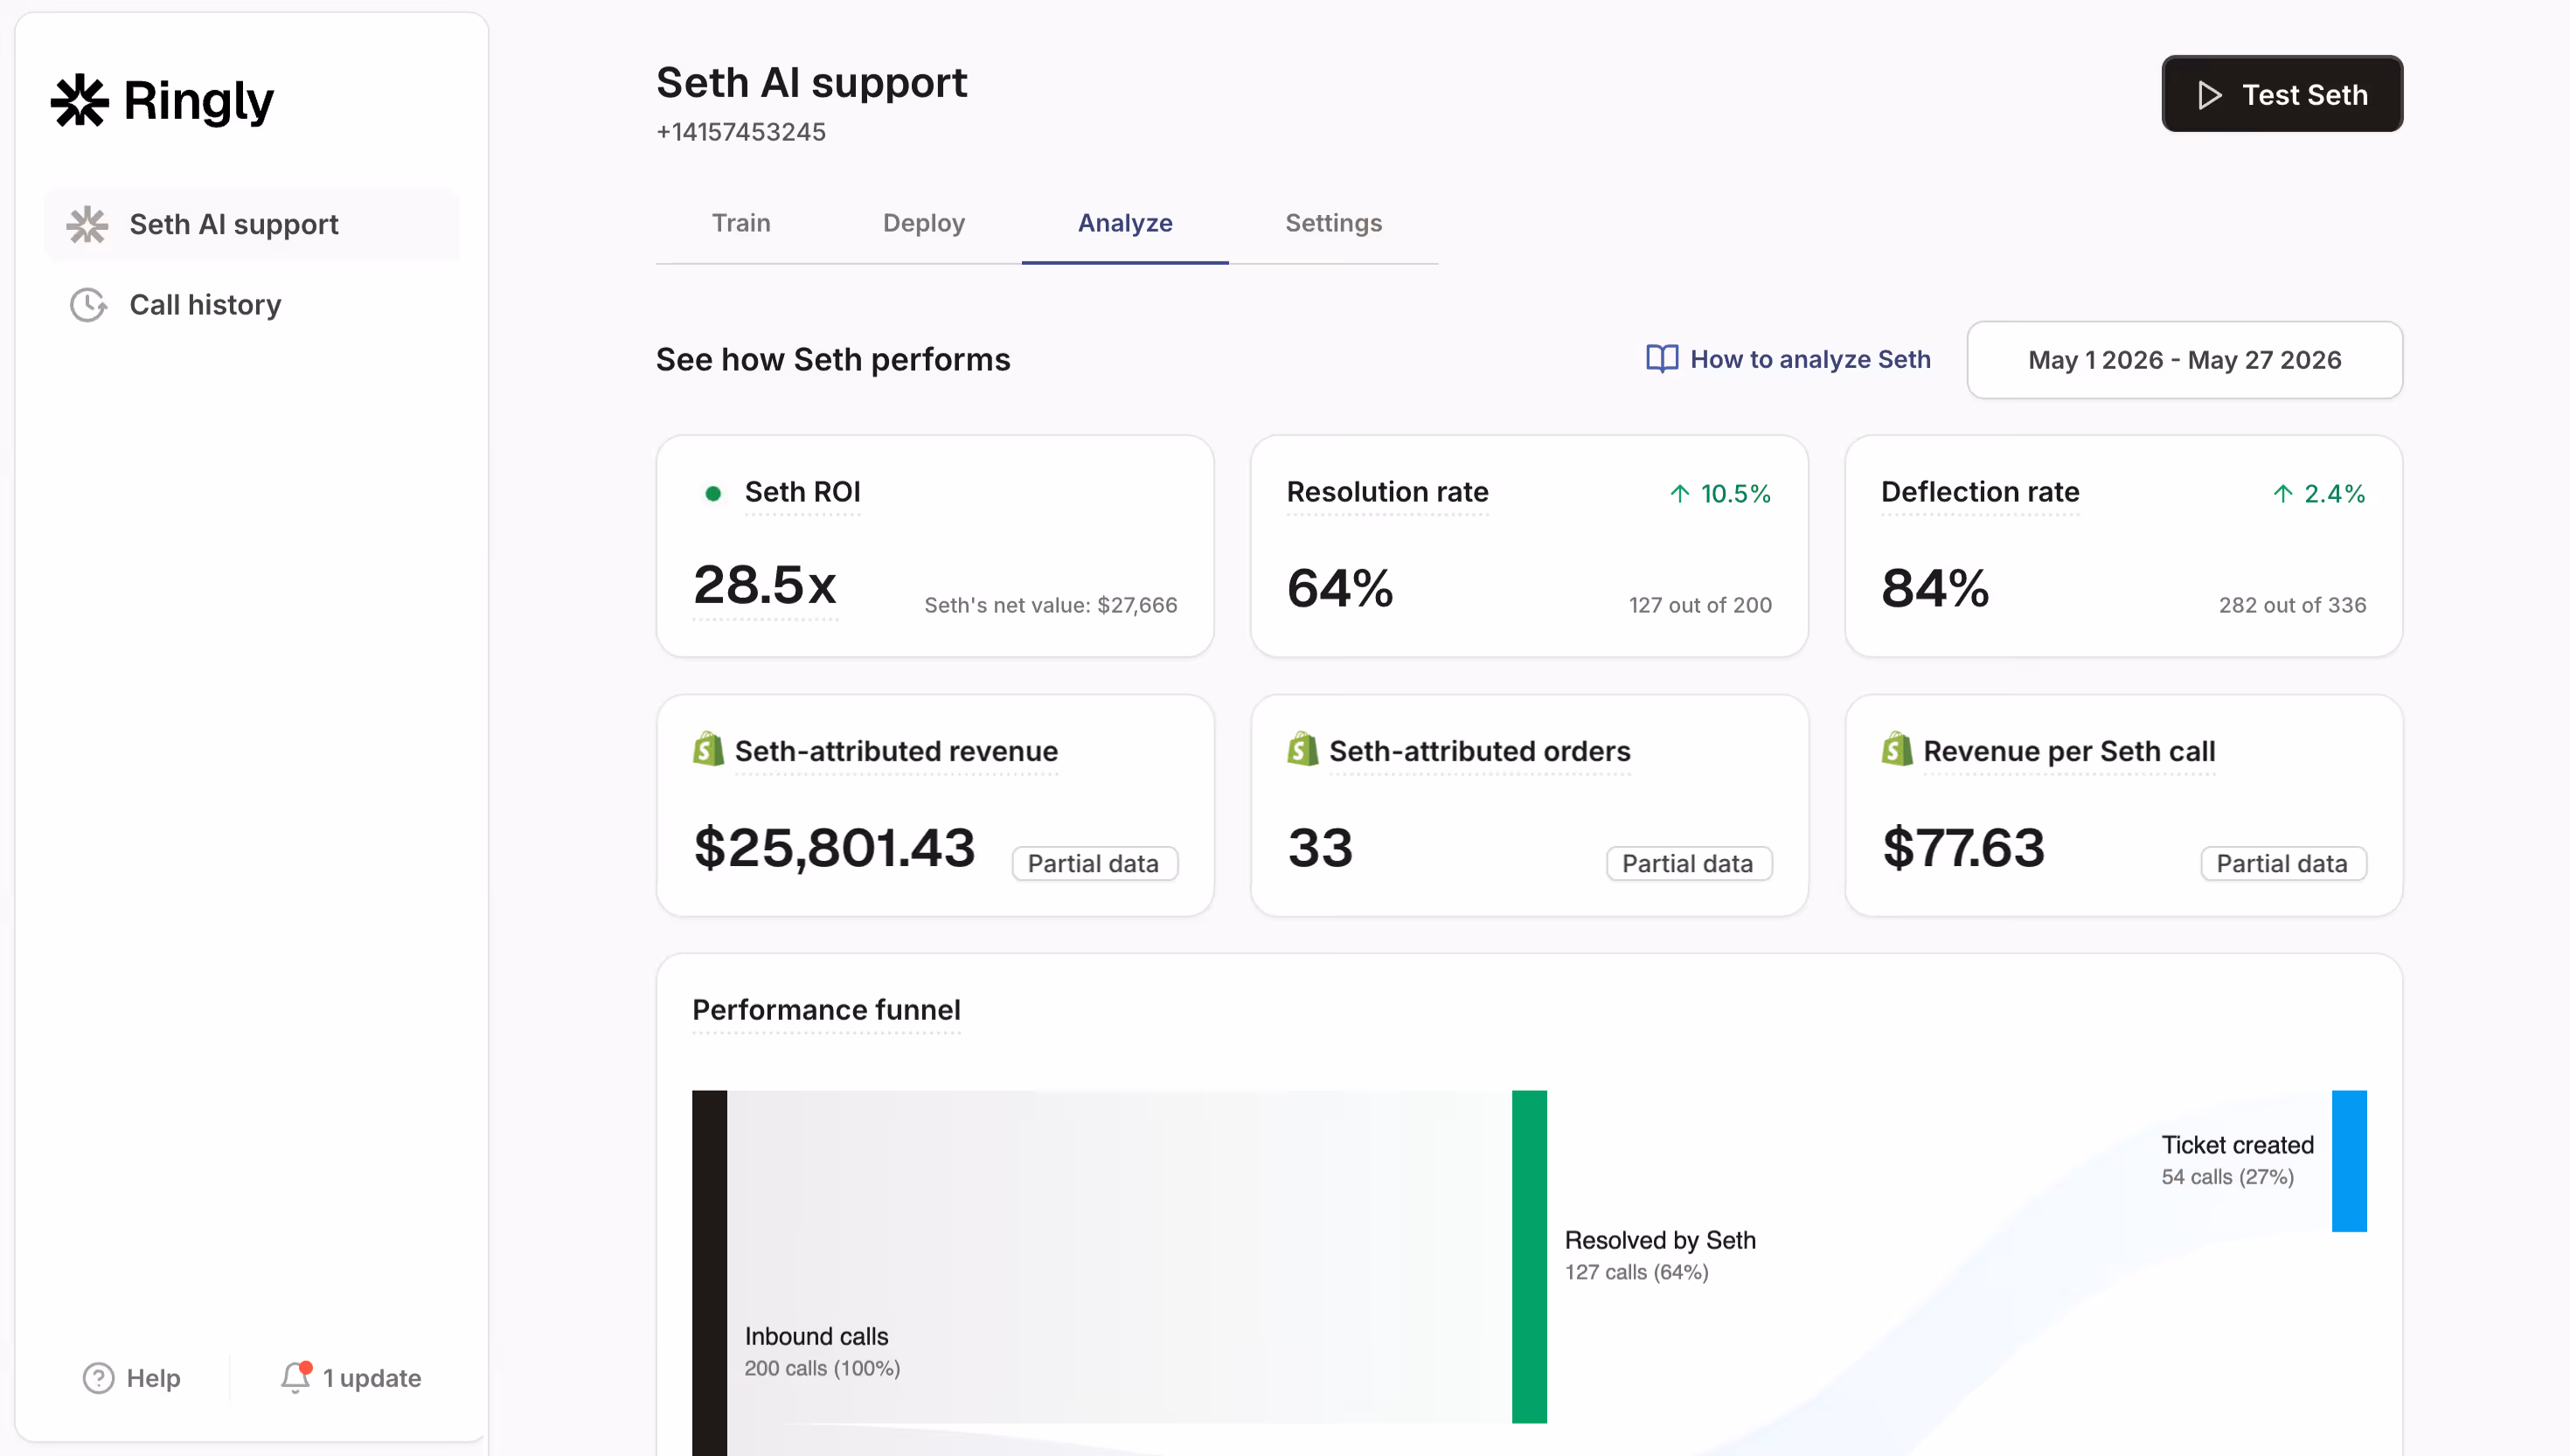
Editor’s note: Want to hear some sample AI support calls made for your Shopify store?
- Just paste your store URL
- Get sample calls in under 20 seconds (no email required)
- Listen to demo calls for my store
Let's break down what this actually means for your store.
What is ecommerce analytics?
Ecommerce analytics is the process of collecting, analyzing, and interpreting data from your online store to make better business decisions.
It covers everything from website traffic and customer behavior to sales transactions and marketing campaign performance.
There are four main types of analytics you'll encounter:
- Descriptive analytics tells you what happened. This is your baseline reporting: total revenue, conversion rates, traffic sources, and sales by product. It answers questions like "How much did we sell last month?" and "Which channel brought the most visitors?"
- Diagnostic analytics digs into why something happened. If your conversion rate dropped 20% this week, diagnostic analysis helps you find the cause. Maybe a checkout page broke, or a traffic source started sending low-quality visitors.
- Predictive analytics forecasts what will happen. Using historical data and patterns, it estimates future sales trends, inventory needs, and customer behavior. This helps you prepare for seasonal demand or identify customers likely to churn.
- Prescriptive analytics recommends what to do next. Advanced systems can suggest optimal pricing, inventory levels, or marketing spend based on your goals.
Most ecommerce businesses start with descriptive analytics and gradually add the other types as they grow.
The key data sources include your website analytics platform, ecommerce platform (Shopify, WooCommerce, etc.), email marketing tools, advertising accounts, and customer service data.
Here's why this matters: according to BARC research cited by Salesforce, 58% of companies still make business decisions based on gut feelings.
The businesses that use data properly have a clear advantage.
The ecommerce analytics metrics that actually matter
You can track hundreds of metrics. Most of them are distractions. Here are the ones that actually drive decisions.
Traffic metrics
Sessions and users show how many people visit your store. A session is one visit (even if someone browses 10 pages), while users counts unique individuals.
Track both, but focus on trends rather than absolute numbers.
Traffic sources tell you where visitors come from: organic search, paid ads, social media, email, or direct.
This matters because each source has different costs and conversion rates. If you're spending $5,000/month on Facebook ads but they convert at 0.5%, while organic search converts at 3%, you know where to invest more.
Device breakdown shows mobile vs desktop usage. If 70% of your traffic is mobile but your mobile conversion rate is half your desktop rate, you have a user experience problem to fix.
Conversion metrics
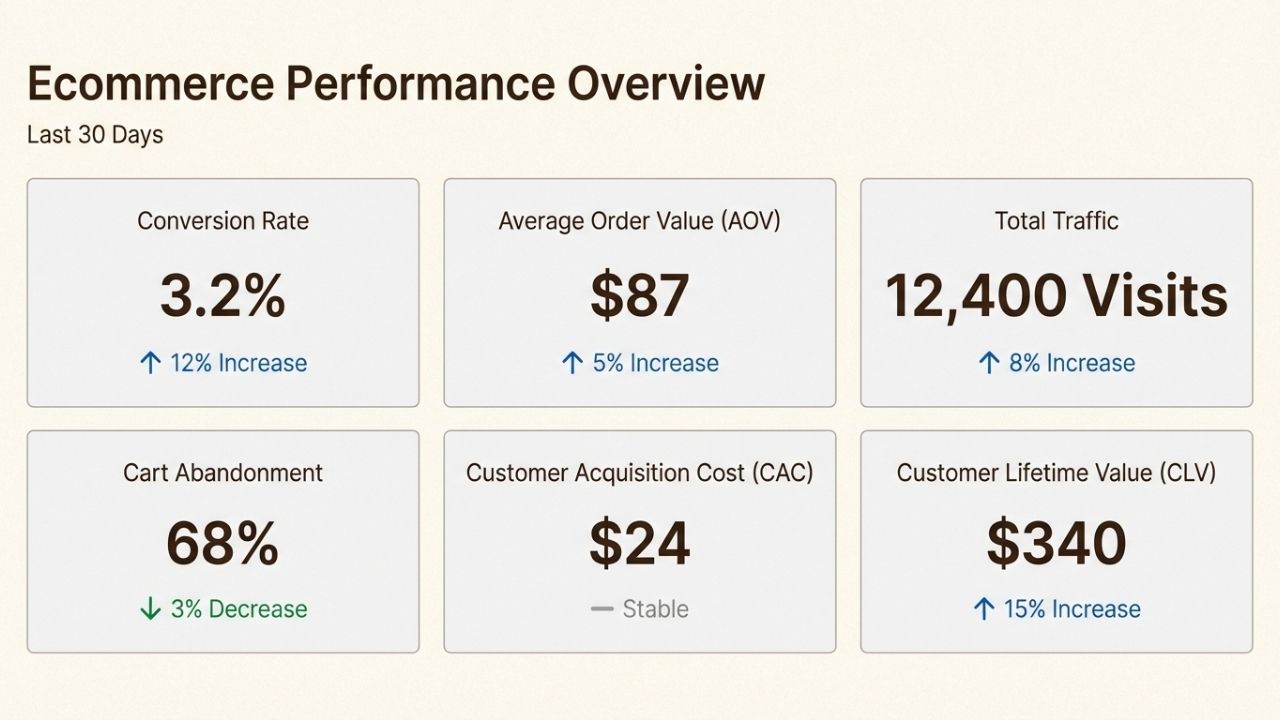
Conversion rate is the percentage of visitors who buy something. Industry averages vary by niche, but most ecommerce stores see 1-3% overall.
Track this by traffic source, device, and landing page to find optimization opportunities.
Cart abandonment rate measures how many people add items to their cart but don't complete the purchase.
The average is around 70%, which means most carts are abandoned. Reducing this by even a few percentage points can significantly boost revenue.
Average Order Value (AOV) is the average amount spent per transaction. Increasing AOV by 10% often has more impact than increasing traffic by 10%, because you're not paying additional acquisition costs.
Customer metrics
Customer Acquisition Cost (CAC) is what you spend to get one new customer. Include ad spend, agency fees, and any other marketing costs.
If your CAC is $50 and your AOV is $45, you're losing money on every first purchase.
Customer Lifetime Value (CLV) estimates how much revenue a customer generates over their entire relationship with you.
A customer who buys once for $50 is worth less than one who makes five purchases totaling $300. This changes how much you can afford to spend acquiring customers.
Repeat purchase rate shows what percentage of customers come back to buy again.
For most ecommerce businesses, repeat customers are more profitable than new ones because you don't pay acquisition costs on subsequent purchases.
Product metrics
Top-performing products by revenue and profit margin. Revenue is nice, but profit matters more.
A product that generates $10,000 in sales with 40% margins beats one that generates $15,000 with 15% margins.
Inventory turnover measures how quickly you sell through stock. Slow turnover ties up cash and increases storage costs. Fast turnover risks stockouts.

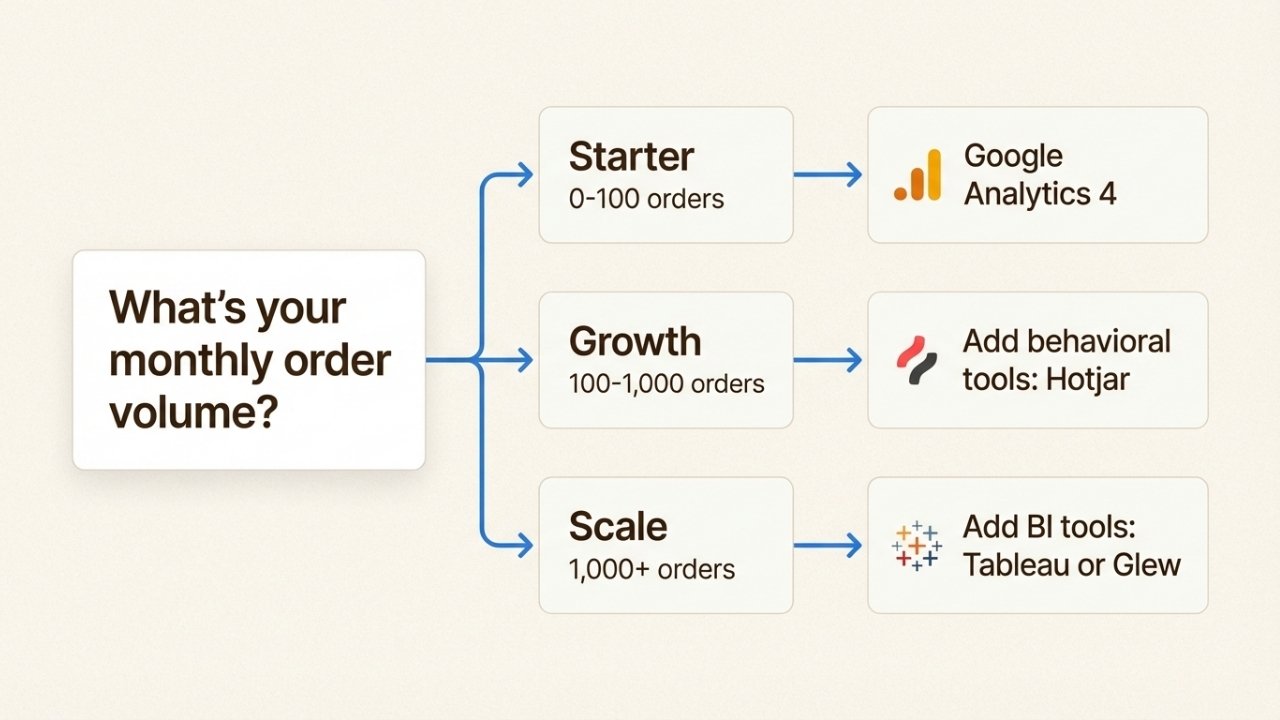
Building your ecommerce analytics framework
The right approach depends on your business size and complexity. Here's how to build your analytics setup at each stage.
Starter stage (0-100 orders per month)
At this stage, keep it simple. You need visibility into the basics without getting overwhelmed.
Tools to use:
- Google Analytics 4 (free)
- Your ecommerce platform's native analytics (Shopify Analytics, WooCommerce reports)
- Basic spreadsheet tracking for weekly metrics
Focus on:
- Traffic sources (where visitors come from)
- Overall conversion rate
- Monthly revenue trend
Implementation checklist:
- Set up GA4 ecommerce tracking on your store
- Configure conversion goals for purchases
- Create a simple weekly dashboard with 5-6 key numbers
- Review monthly to spot trends
Growth stage (100-1,000 orders per month)
Now you need deeper insights to optimize what's working and fix what's not.
Add these tools:
- Email platform analytics (Klaviyo, Mailchimp, etc.)
- Advertising platform data (Facebook Ads Manager, Google Ads)
- Basic cohort analysis (can be done in spreadsheets or tools like Amplitude)
Add these metrics:
- CAC by channel
- AOV by traffic source
- Repeat purchase rate
- Email campaign performance
Implementation checklist:
- Set up UTM tracking for all marketing campaigns
- Create customer segments based on behavior
- Build a monthly cohort analysis to track retention
- Start A/B testing key pages (product pages, checkout)
Scale stage (1,000+ orders per month)
At this volume, manual analysis becomes impractical. You need automation and predictive capabilities.
Consider these tools:
- Business intelligence platforms (Tableau, Looker, Glew)
- Customer data platforms (Segment, mParticle)
- Predictive analytics tools
Add these capabilities:
- xCLV prediction models
- Demand forecasting
- Automated anomaly detection
- Real-time dashboards
Implementation checklist:
- Centralize data from all sources into a data warehouse
- Build automated reporting dashboards
- Implement predictive models for inventory and marketing
- Set up alerts for significant metric changes
The key is starting simple and adding complexity only when you have clear use cases.
Most businesses fail at analytics not because they lack data, but because they have too much and don't know what to do with it.
Using ecommerce analytics to drive revenue
Collecting data is easy. Using it to make money is harder. Here's how successful stores turn analytics into revenue.
Improve customer acquisition
Analytics helps you identify your highest-converting traffic sources.
You might discover that Instagram brings lots of visitors but few sales, while your email newsletter has a 5% conversion rate. This tells you where to invest.
Tactics that work:
- Compare CAC across channels and double down on the winners
- Analyze landing page performance and fix pages with high bounce rates
- Use A/B testing to improve conversion rates on key pages
- Track customer quality by channel (some sources bring bargain hunters, others bring loyal customers)
Nearly 90% of users begin their shopping experience with an online search, according to WebFX research cited by Salesforce.
Understanding which search terms bring buyers versus browsers helps you optimize SEO and SEM spend.
Optimize customer retention
Acquiring a new customer costs 5-7x more than retaining an existing one. Analytics shows you who to keep and how to keep them.
Tactics that work:
- Segment customers by value and engagement
- Identify at-risk customers before they churn (declining engagement, support tickets, etc.)
- Personalize email campaigns based on purchase history
- Track time between purchases to trigger re-engagement campaigns
Adobe's 2025 research found that night owls (just 9% of shoppers) spend the most per year, averaging $3,684 annually.
Understanding when your best customers shop helps you time marketing campaigns for maximum impact.
Optimize product strategy
Your product mix significantly impacts profitability.
Analytics reveals which products to promote, which to discontinue, and which combinations drive higher order values.
Tactics that work:
- Use basket analysis to identify cross-sell opportunities
- Analyze margin by product to focus on profitable items
- Track inventory turnover to optimize stock levels
- Test dynamic pricing based on demand patterns
One often-overlooked opportunity: analyzing returns data.
If a particular product has a 30% return rate while others are at 5%, there's likely a product description, sizing, or quality issue to address.
Common ecommerce analytics challenges
Even with the right tools and metrics, businesses hit obstacles. Here are the most common ones and how to solve them.
Data silos
Your ecommerce platform, email tool, ad accounts, and CRM all collect data separately.
This makes it hard to see the complete customer journey.
Solution: Use integration tools like Zapier or dedicated customer data platforms to centralize information.
Start with your most important data sources rather than trying to connect everything at once.
Data quality issues
Bad data leads to bad decisions. Common problems include duplicate customer records, missing transaction data, and inconsistent tracking.
Solution: Implement regular data hygiene practices. Audit your tracking setup quarterly. Set up validation rules to catch obvious errors (like orders with $0 values or impossible conversion rates).
Analysis paralysis
With so much data available, it's easy to spend more time analyzing than acting. Many businesses build elaborate dashboards that nobody uses.
Solution: Focus on decisions, not dashboards. Before pulling any data, ask: "What decision will this inform?" If you can't answer, you don't need that data yet.
Start with one metric you want to improve and build from there.
Privacy compliance
GDPR, CCPA, and other regulations limit how you can track and use customer data. Browser privacy features are making tracking harder too.
Solution: Be transparent about data collection. Use first-party data strategies (data you collect directly) rather than relying solely on third-party cookies.
Implement proper consent management.
Tool overload
The analytics market is crowded. New tools promise better insights every month, leading to fragmented setups and wasted spend.
Solution: Start with free tools and upgrade only when you hit clear limitations.
Most businesses can go surprisingly far with Google Analytics 4 and their ecommerce platform's native reporting.
Add specialized tools only for specific needs that aren't met.
Choosing the right ecommerce analytics tools
The tool landscape is overwhelming. Here's a practical breakdown of categories and when to use each.
Free and starter tools
Google Analytics 4 is the starting point for most stores. It's free, comprehensive, and integrates with most platforms.
The learning curve is steep, but the capabilities are powerful once you master them.
Platform-native analytics (Shopify Analytics, WooCommerce reports) provide quick insights without setup complexity.
They're limited compared to dedicated tools but perfect for beginners.
Behavioral analytics
Tools like Hotjar and Contentsquare show what visitors actually do on your site. Heatmaps reveal where people click, scroll maps show how far they read, and session recordings let you watch real user journeys.
Best for: Identifying UX problems, understanding why visitors don't convert, optimizing page layouts.
Product analytics
Amplitude and Mixpanel focus on user behavior and conversion funnels. They're stronger than GA4 for understanding customer journeys and cohort retention.
Best for: Growth-stage businesses optimizing conversion funnels and retention.
Business intelligence
Tableau, Looker, and similar tools connect to multiple data sources and create custom dashboards. They require more technical setup but offer unlimited flexibility.
Best for: Scale-stage businesses with dedicated data teams or analysts.
Selection criteria
When evaluating tools, consider:
- Integration ease: Does it connect to your existing stack?
- Learning curve: Can your team use it effectively?
- Cost: Are you paying for features you'll actually use?
- Scalability: Will it handle your growth for the next 1-2 years?
The best tool is the one your team will actually use. A complex BI platform that nobody touches is worse than a simple spreadsheet you update weekly.
Getting started with ecommerce analytics today
You don't need to build a perfect analytics setup overnight. Here's what to do this week.
Day 1-2: Audit your current data collection. Make sure Google Analytics 4 (or your chosen platform) is properly tracking transactions. Fix any obvious gaps.
Day 3-4: Set up conversion tracking if you haven't already. This means purchase events are firing correctly, and you can see revenue in your analytics platform.
Day 5: Pick one metric to improve. Maybe it's conversion rate, or AOV, or repeat purchase rate. Create a simple plan to move that number.
Week 2 and beyond: Build the habit of reviewing your metrics weekly. Don't just look at the numbers, ask why they changed. Then take action based on what you learn.
Remember, analytics is only valuable if you act on it. A simple spreadsheet you review weekly beats a fancy dashboard you ignore.
While you're optimizing your store's data strategy, consider another often-overlooked data source: phone conversations. Ringly.io captures insights from customer calls that most analytics platforms miss, helping you understand why customers call and what they're asking about.
For benchmark data to measure against, explore our ecommerce conversion rate statistics for 2026.
To visualize all this data effectively, you need the right dashboard. Our ecommerce dashboards guide covers the best options available.
Frequently Asked Questions
What is ecommerce analytics and why does it matter for my online store?
Ecommerce analytics is the process of collecting and analyzing data from your online store to make better business decisions. It matters because it helps you understand which marketing channels work, which products drive profit, and where customers get stuck, allowing you to optimize for growth instead of guessing.
Which ecommerce analytics metrics should I track first?
Start with conversion rate, average order value, and traffic sources. These three metrics tell you if visitors are buying, how much they spend, and where they come from. Add customer acquisition cost and customer lifetime value as you grow.
What's the best free ecommerce analytics tool for beginners?
Google Analytics 4 is the best free option. It tracks traffic, conversions, and revenue when properly configured. Most ecommerce platforms also have built-in analytics that are easier to use but less detailed.
How often should I review my ecommerce analytics?
Check key metrics weekly for trends and anomalies. Do deeper analysis monthly to understand patterns and make strategic decisions. Daily checking often leads to overreaction to normal fluctuations.
Can ecommerce analytics help reduce cart abandonment?
Yes. Analytics identifies where in the checkout process customers drop off. You can then test fixes like simplified forms, guest checkout options, or exit-intent offers to recover abandoned carts.
What's the difference between descriptive and predictive ecommerce analytics?
Descriptive analytics tells you what happened (last month's sales, conversion rates). Predictive analytics forecasts what will happen (expected demand next quarter, customers likely to churn). Start with descriptive, add predictive as you grow.
How do I avoid data overload with ecommerce analytics?
Focus on decisions, not dashboards. Before pulling any data, ask what decision it will inform. Track fewer metrics but review them regularly. Start simple and add complexity only when you have clear use cases.