

Running an online store without tracking your data is like driving with your eyes closed.
You might get somewhere, but you won't know how you got there or whether you're heading in the right direction.
Shopify Analytics solves this problem by giving every merchant a built-in reporting system that works out of the box.
No complicated setup, no developer required, no additional fees.
You get real-time insights into your sales, customers, and store performance from day one.
Editor’s note: Want to hear some sample AI support calls made for your Shopify store?
- Just paste your store URL
- Get sample calls in under 20 seconds (no email required)
- Listen to demo calls for my store
Let's break down what Shopify Analytics actually does, how to use it effectively, and when you might need to supplement it with additional tools.
What is Shopify Analytics and why it matters
Shopify Analytics is the native reporting platform built into every Shopify store.
It tracks your sales, orders, traffic, and customer behavior automatically, presenting everything in an easy-to-understand dashboard.
The key thing to remember is that it's designed specifically for e-commerce, not general website analytics.
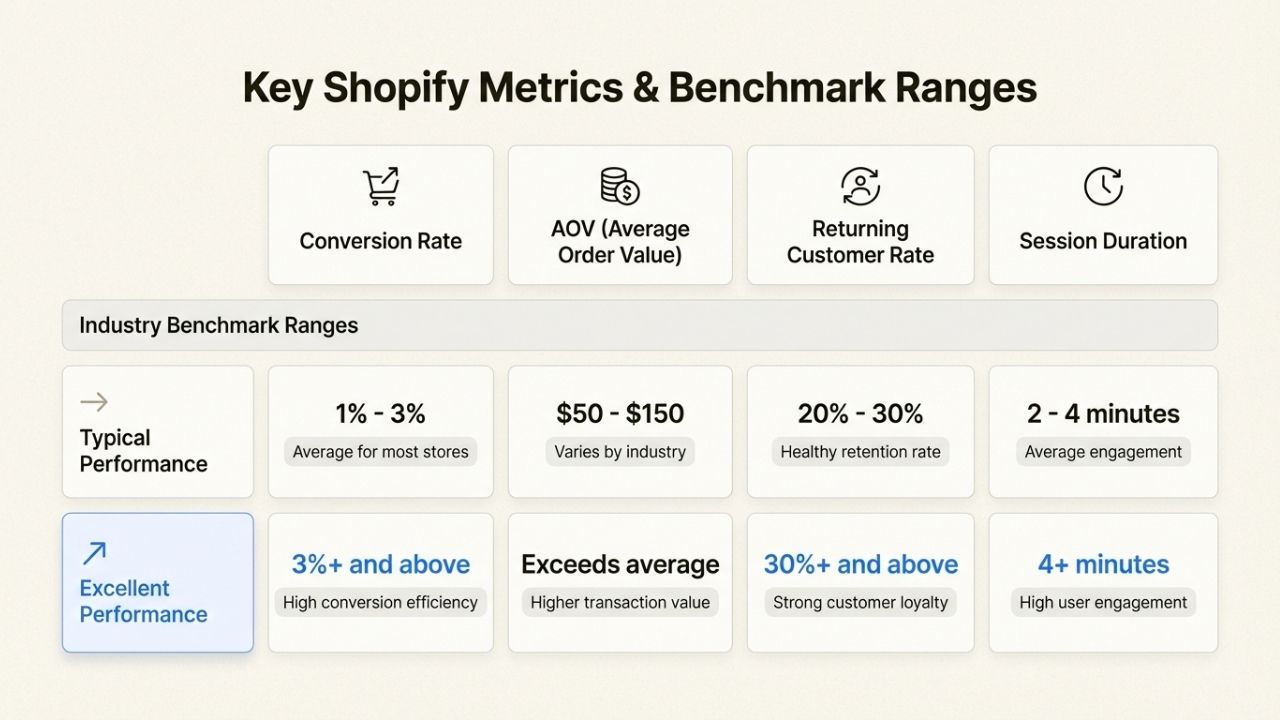
This means the metrics actually matter to store owners: total sales, conversion rates, average order value, and returning customer rates.
You won't find yourself drowning in pageview counts that don't translate to revenue.
Shopify makes Analytics available to merchants on any subscription plan, though the depth of reporting varies.
Even the most basic plan includes useful reports covering acquisition, behavior, customers, and sales.
As you move up to Shopify Advanced or Plus, you unlock custom reporting with ShopifyQL (Shopify's query language) and deeper data exploration.
Here's the short version: if you want to understand how your store is performing without hiring a data analyst, Shopify Analytics is your starting point.
How to access and navigate your analytics dashboard
Getting to your analytics is straightforward. From your Shopify admin, click Analytics in the left sidebar.
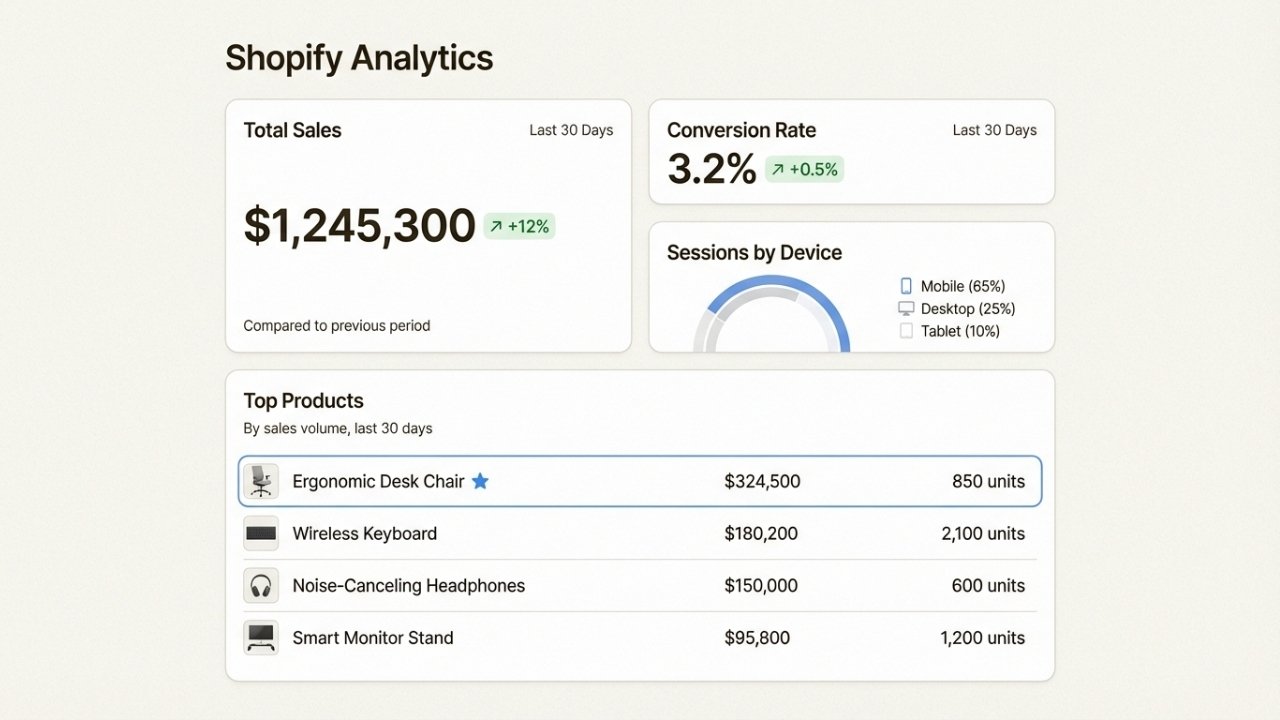
You'll land on the overview dashboard showing your most important metrics as customizable cards.
Each card displays a key metric with percentage change from your selected comparison period. Click any card to dive into the full report behind that number.
The date range selector (calendar icon) lets you analyze any time period you need:
- Fixed ranges for specific campaigns or quarters (January 1-31, 2025)
- Rolling ranges that update automatically (last 7 days, last 30 days)
- Custom time windows down to the minute for monitoring live events
You can also compare your selected period to previous timeframes.
This is useful for answering questions like "How did this Black Friday compare to last year?" or "Are my conversion rates improving month over month?"
Customizing your dashboard is where Shopify Analytics gets powerful. Click Customize to:
- Drag and drop cards to rearrange them
- Add new cards from the metrics library
- Create custom sections to organize related metrics
- Resize cards to emphasize what matters most
Changes sync across desktop and mobile, so your setup works wherever you check your store.
Data refreshes automatically every 60 seconds when you're viewing current date ranges. For historical data, reopen the dashboard or refresh your browser to see the latest numbers.
Key metrics every store owner should track
Not all metrics are created equal. Here are the ones that actually drive decision-making for e-commerce businesses.
Sales metrics
Total sales is your headline number, but dig deeper. Look at sales by channel to see whether customers are finding you through your online store, social media, marketplaces, or in-person POS. This tells you where to invest marketing budget.
Average order value (AOV) reveals whether you're successfully upselling and cross-selling. If AOV is flat while traffic grows, you're leaving money on the table.
Net sales (total minus discounts and returns) gives you the real picture of revenue health. High gross sales with heavy discounting isn't sustainable growth.
Traffic and behavior metrics
Sessions count individual browsing periods, while visitors count unique people. The same person can generate multiple sessions, so sessions will always be higher.
This distinction matters when calculating conversion rates.
Speaking of conversion rates, don't obsess over the headline number without context.
A blog post going viral might drop your store-wide conversion rate because informational traffic doesn't buy immediately.
Instead, check conversion rate by landing page and conversion rate by traffic source to spot the real issues.
Sessions by device (desktop, mobile, tablet) can reveal technical problems. If mobile conversion lags desktop by 50%, your mobile experience probably needs work.
Customer metrics
Returning customer rate indicates loyalty and product-market fit. For most e-commerce businesses, 20-30% returning customers is healthy.
Lower suggests issues with product quality or post-purchase experience.
Top customers identifies your VIPs. These are the people driving disproportionate revenue. Consider special treatment, early access, or personal outreach.
Understanding Shopify Analytics reports
The dashboard gives you quick numbers. Reports give you the story behind them.
Acquisition reports
These show how visitors find your store. You'll see breakdowns by:
- Search engines (organic vs paid)
- Social platforms (which ones drive actual sales)
- Direct traffic (bookmarks, typed URLs)
- Referrals (links from other websites)
This is where you validate your marketing spend. If Instagram drives tons of traffic but no conversions, you're attracting browsers, not buyers.
Behavior reports
The online store conversion funnel is critical. It shows how many visitors:
- Added something to cart
- Reached checkout
- Actually purchased
Drop-off between these stages reveals friction points. If 10% add to cart but only 1% purchase, your checkout process is broken.
Landing page reports show which pages convert best. Your homepage might get the most traffic, but a specific product page or collection might drive the most revenue per visitor.
Customer reports
Understand who buys from you.
First-time vs returning customer trends show whether you're building a loyal base or constantly churning through new acquisitions.
The latter is expensive and unsustainable.
Customer cohort analysis (available on higher plans) tracks groups of customers over time.
Did customers acquired during your holiday sale come back in January? This predicts lifetime value.
Marketing reports
If you use Shopify's marketing tools, these reports attribute sales to specific campaigns.
You can track email performance, ad results, and promotional effectiveness in one place.
Financial reports
Beyond sales numbers, these cover payments, taxes, and profit margins.
The profit margin report factors in cost of goods sold to show true profitability, not just revenue.
Every report can be customized with filters, date ranges, and exported for further analysis.
Custom reports you create become new metric cards available in your dashboard library.
Shopify Analytics vs Google Analytics 4: When to use each
Here's where things get interesting. Shopify Analytics is great, but it's not the only tool you should consider.
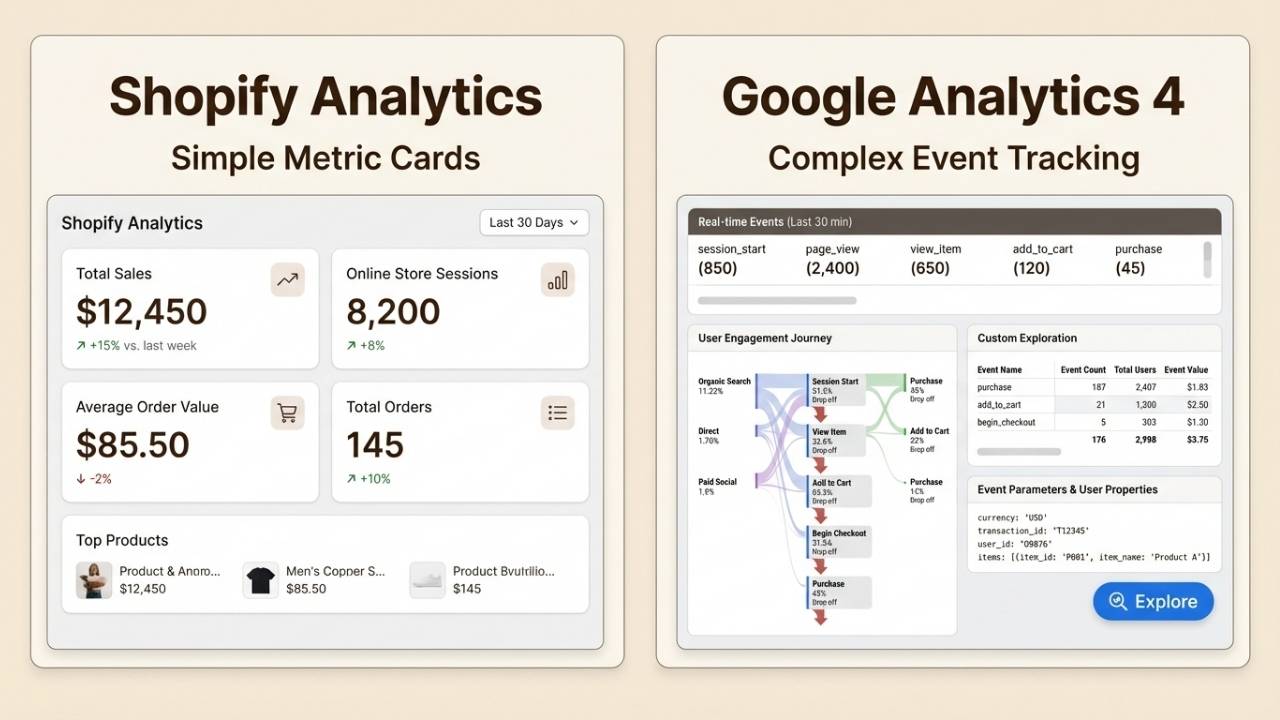
What Shopify Analytics does best
Shopify Analytics shines for daily monitoring and commerce-specific questions. It knows your products, orders, and customers natively.
The data is real-time, the interface is intuitive, and it requires zero configuration.
If you want to check today's sales, see which products are trending, or understand your conversion funnel by traffic source, Shopify Analytics is faster and more relevant than alternatives.
What Google Analytics 4 adds
Google Analytics 4 (GA4) is a different beast. It's designed for deep analysis across multiple websites and platforms, not just your Shopify store.
GA4 brings capabilities Shopify Analytics lacks:
- Cross-domain tracking to follow customers from your blog to your store to your checkout
- Custom funnels with multiple steps and branching paths
- Enhanced conversion tracking with detailed event data
- Predictive insights powered by machine learning
- Audience building for remarketing campaigns
- BigQuery integration for data warehousing and SQL analysis
The trade-off is complexity. GA4 has a learning curve. The interface is less intuitive, and you need to configure it properly to get meaningful data.
The recommended approach
Bottom line? Use both.
Shopify Analytics for daily monitoring, quick checks, and commerce-specific metrics. It's your dashboard for understanding store health at a glance.
GA4 for deep analysis, cross-channel attribution, and advanced segmentation. It's your research tool for answering complex questions about customer behavior.
Setting up GA4 on Shopify is straightforward.
Go to your Shopify admin, navigate to Online Store > Preferences, and add your GA4 measurement ID (G-XXXXXXXXXX) in the Google Analytics section.
For more advanced setups including server-side tracking and enhanced e-commerce events, tools like Analyzify can handle the technical configuration.
Common GA4 issues to watch for: data discrepancies between Shopify and GA4 (normal due to different tracking methods), inflated direct traffic (often misattributed social or email traffic), and unwanted referrals from payment providers like PayPal or Stripe.
Live View: Monitoring your store in real time
Live View is one of Shopify Analytics' most addictive features. It shows what's happening in your store right now.
You'll see:
- Active visitors currently browsing
- Total sales in your selected time window
- Sessions and orders updating in real time
- A world map showing where visitors are located
- Top products being viewed and purchased
- Customer behavior breakdown (checking out, adding to cart, purchasing)
This is invaluable during flash sales, product launches, or Black Friday Cyber Monday.
You can watch the impact of your marketing campaigns as they happen and make adjustments on the fly.
Sessions end after 30 minutes of inactivity or at midnight UTC.
The same visitor can generate multiple sessions, which is why session counts are typically higher than visitor counts.
Third-party analytics tools to consider
Sometimes native analytics isn't enough. As your store grows, you might need specialized tools.
Polar Analytics positions itself as an all-in-one data stack for omnichannel DTC brands. It unifies data from Shopify, Amazon, retail POS, and marketing platforms into one dashboard.
With AI-powered insights and incrementality testing, it's designed for brands doing serious volume across multiple channels.
Analyzify focuses specifically on GA4 setup and server-side tracking for Shopify stores.
If you're struggling with data accuracy or want to implement enhanced conversion tracking without coding, they handle the technical heavy lifting.
But here's something most analytics discussions miss: what customers actually say when they contact you.
Analytics tools tell you what happened. They don't tell you why. That's where Ringly.io comes in.

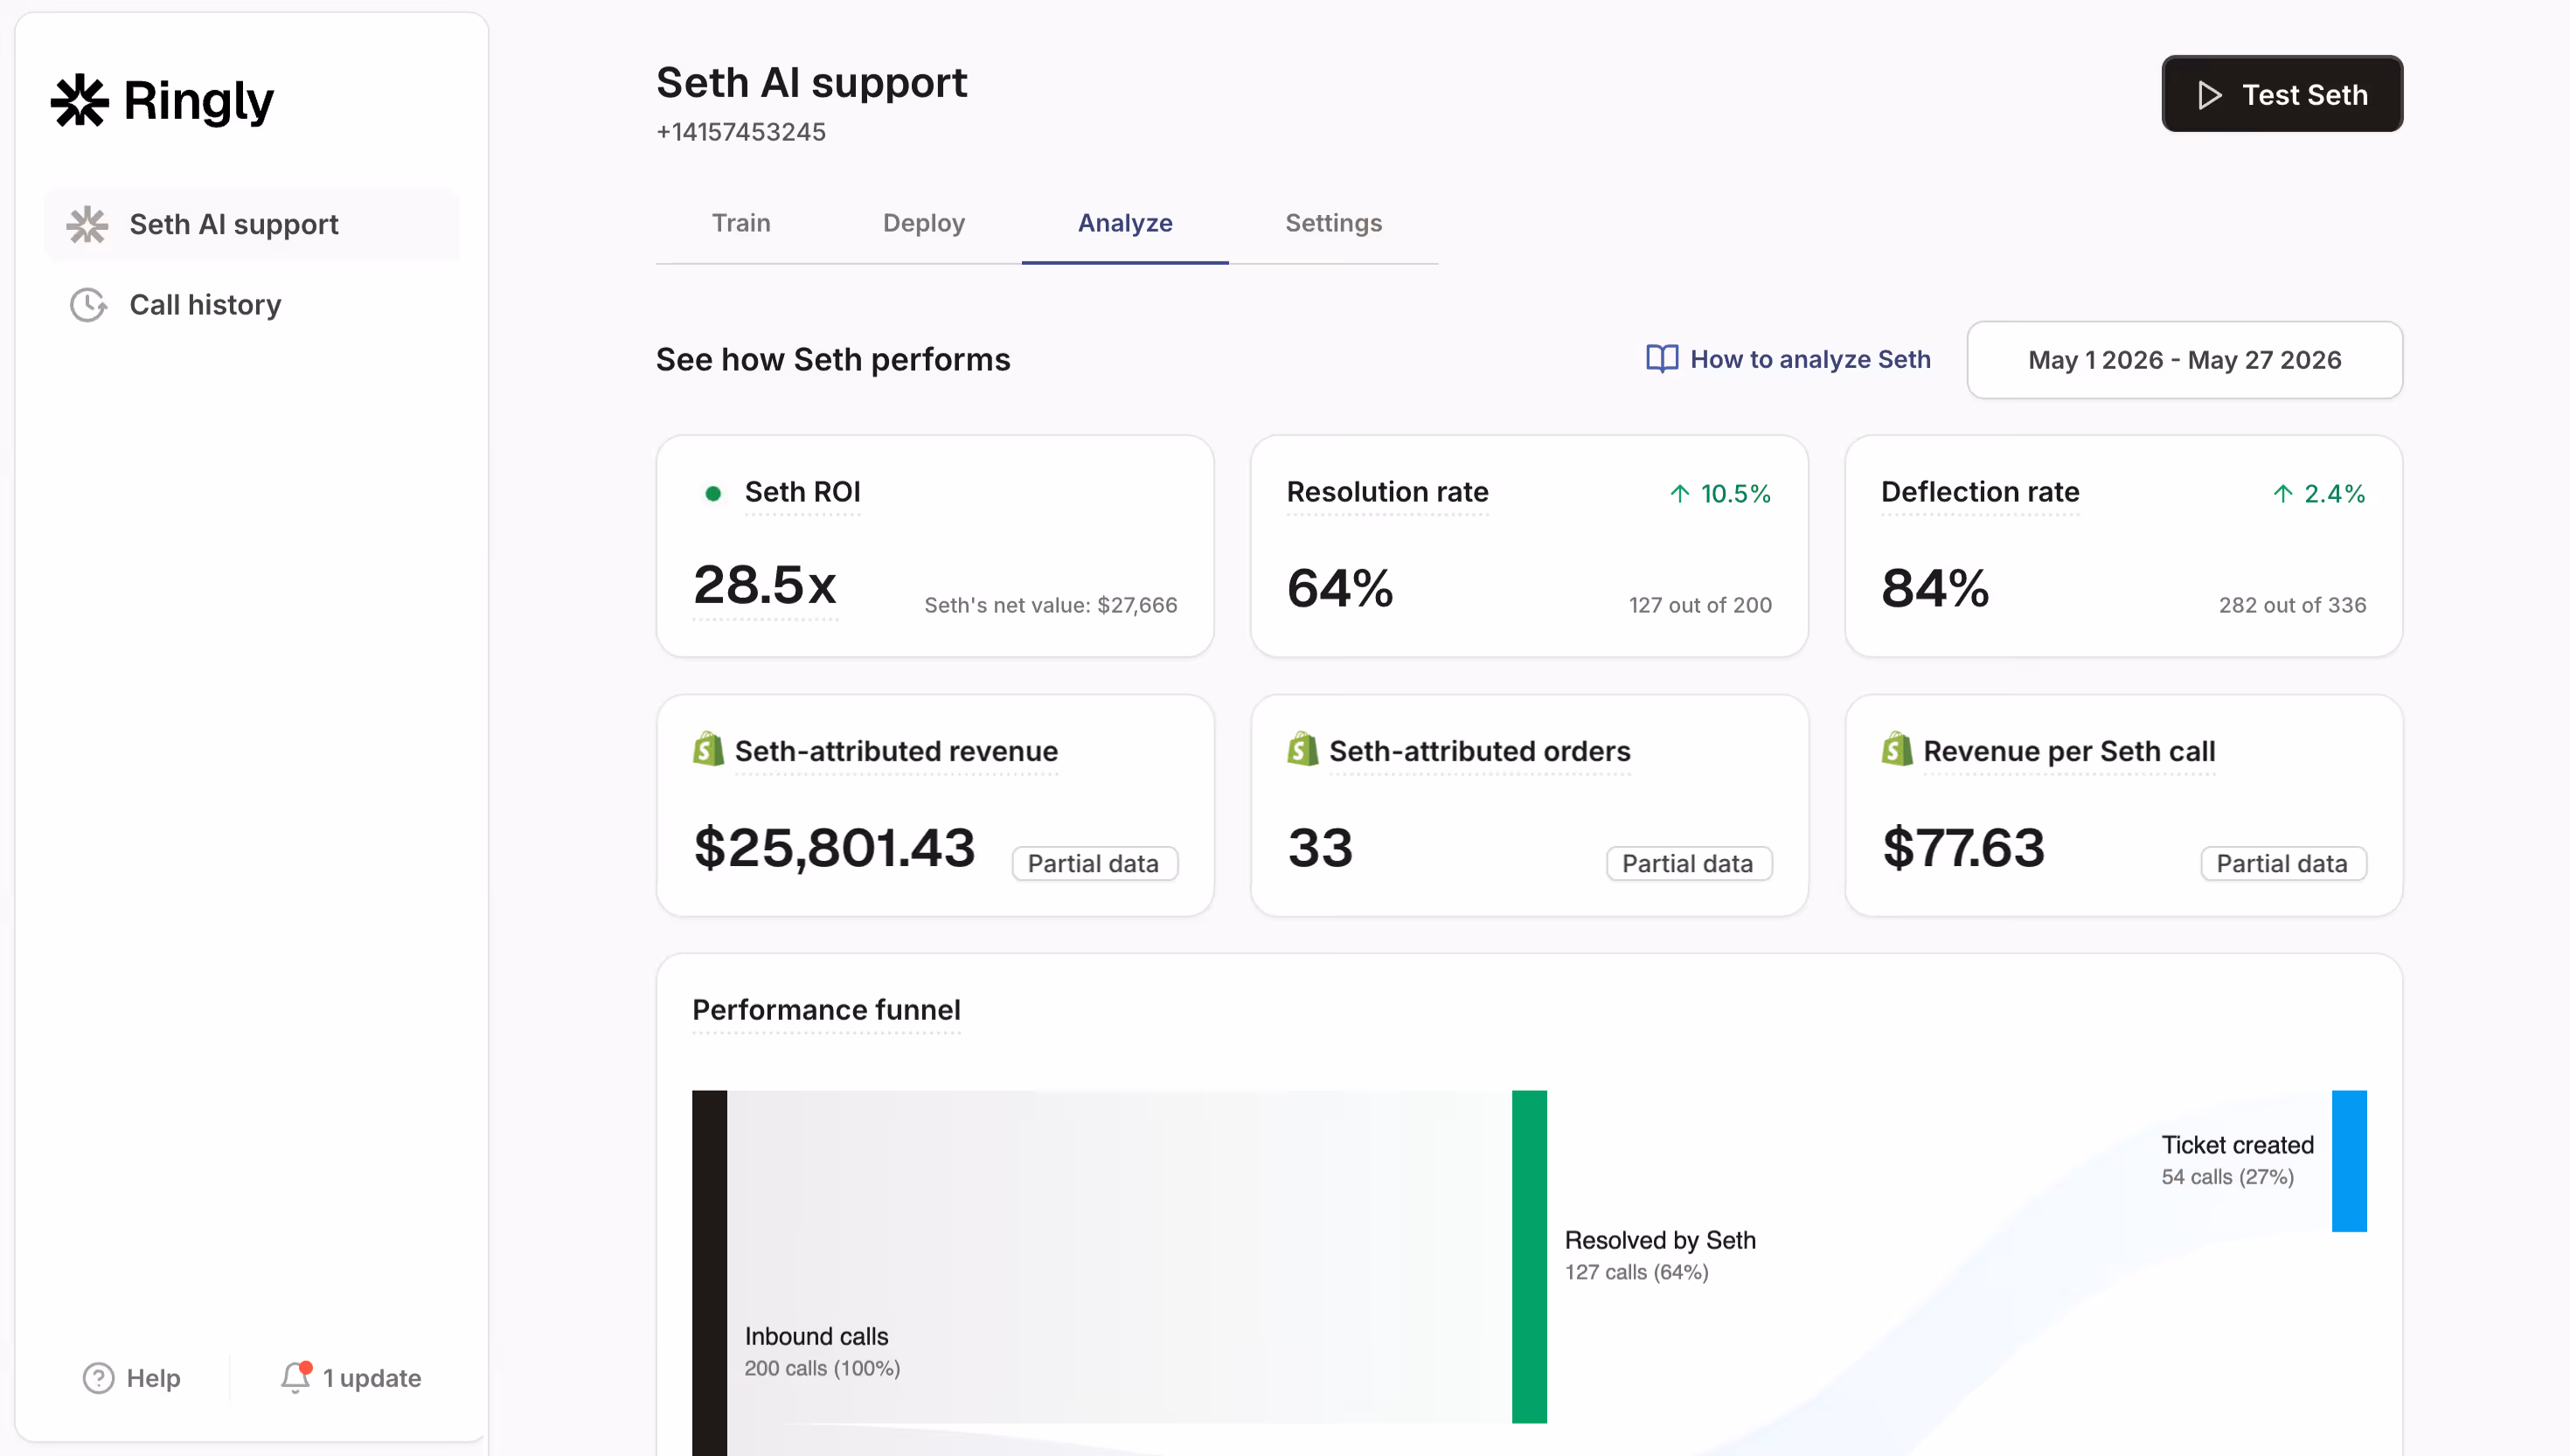
Ringly.io's AI phone agent, the AI, handles customer calls 24/7 and captures something pure data can't: the actual conversations.
The transcripts and call analytics reveal why customers are calling, what questions keep coming up, and where your self-service content is falling short.
For example, your Shopify Analytics might show a spike in cart abandonment.
But the AI's call records might reveal that customers are confused about shipping times or struggling to find sizing information. That's actionable insight that numbers alone can't provide.
If you're serious about understanding your customers, you need both quantitative analytics (what they do) and qualitative insights (what they say).
Ringly.io bridges that gap for phone support.
Getting the most from your Shopify analytics
Data is only valuable if you act on it. Here's how to build an analytics routine that drives results.
Set a review schedule. Check your dashboard daily for anomalies or trends.
Do a deeper weekly review of reports to understand what's working. Monthly, analyze cohort behavior and customer lifetime value trends.
Organize your dashboard by goal. Create custom sections for acquisition (traffic sources, new visitors), conversion (funnel metrics, AOV), and retention (returning customers, repeat purchase rate).
This keeps you focused on outcomes, not just numbers.
Connect insights to action. When you spot a trend, ask "so what?" If conversion drops, check your landing pages.
If AOV drops, review your upsell strategy. If returning customer rate falls, examine your post-purchase email sequence.
Supplement with qualitative data. Analytics tells you what happened. Customer feedback tells you why.
Tools like Ringly.io capture the voice of your customers through phone conversations, revealing insights that pure data misses.
Don't analysis-paralysis yourself. Perfect data doesn't exist. Shopify Analytics is accurate enough for decision-making.
Focus on trends and comparisons rather than obsessing over exact numbers.
Remember, analytics is a tool for making better decisions, not a replacement for judgment.
The merchants who win are the ones who combine data with customer understanding and take action.
Frequently Asked Questions
Is Shopify Analytics free with my store?
Yes, Shopify Analytics is included with every Shopify plan at no additional cost. Basic reports are available on all plans, while Advanced and Plus plans unlock custom reporting and ShopifyQL query capabilities.
How accurate is Shopify Analytics compared to Google Analytics?
Both are accurate but measure differently. Shopify Analytics tracks from your store's backend (server-side), while Google Analytics tracks from the visitor's browser (client-side). Small discrepancies are normal. Shopify typically shows higher order counts because it captures transactions even if the tracking pixel doesn't fire.
Can I use Shopify Analytics for multiple stores?
Each Shopify store has its own Analytics dashboard. To view data across multiple stores, you'll need a third-party tool like Polar Analytics or a custom data warehouse solution that pulls from each store's API.
What's the difference between sessions and visitors in Shopify Analytics?
A visitor is a unique person (tracked by cookie), while a session is a browsing period. One visitor can have multiple sessions. Sessions end after 30 minutes of inactivity or at midnight UTC. This is why session counts are typically higher than visitor counts.
How do I track phone orders in Shopify Analytics?
Phone orders processed through your Shopify admin count toward your analytics just like online orders. If you want to track why customers are calling and what they're asking about, consider using Ringly.io to capture call transcripts and analytics alongside your Shopify data.
Can I export data from Shopify Analytics?
Yes, most reports can be exported as CSV files for further analysis in Excel, Google Sheets, or business intelligence tools. Advanced and Plus plans also offer API access for automated data pulls.
How far back does Shopify Analytics data go?
Shopify stores data for the lifetime of your store, though the dashboard defaults to showing recent periods. You can access historical data by adjusting your date range selectors. Note that some detailed reports may have shorter retention periods depending on your plan.