

Running an online store without proper reporting is like driving with your eyes closed.
You might get where you're going, but the chances of crashing are high.
Every day, ecommerce businesses lose money to inventory mistakes, wasted ad spend, and missed opportunities simply because they cannot see what is actually happening in their operations.
Ecommerce reporting solves this problem. It transforms the raw data your store generates, orders, traffic, customer behavior, into clear insights that help you make better decisions.
Whether you are just starting out or managing a high-volume store, understanding your numbers is the difference between guessing and growing.
Editor’s note: Want to hear some sample AI support calls made for your Shopify store?
- Just paste your store URL
- Get sample calls in under 20 seconds (no email required)
- Listen to demo calls for my store

This guide covers everything you need to know about ecommerce reporting.
We will walk through the essential metrics, the types of reports that matter, the tools available, and a practical framework for getting started without getting overwhelmed.
What is ecommerce reporting?
Ecommerce reporting is the process of collecting, analyzing, and presenting data about your online store's performance.
Unlike general website analytics that might focus on page views and session duration, ecommerce reporting centers on commerce-specific metrics: orders, revenue, conversion rates, and customer behavior throughout the buying journey.
At its core, ecommerce reporting answers business questions. How much did we sell last month?
Which products are driving profit? Where are customers dropping off? Are our marketing campaigns paying off? Good reporting does not just show you numbers. It helps you understand what those numbers mean for your business.
The scope typically covers three main areas: products (what is selling and what is not), orders (transaction volume, values, and trends), and customers (who is buying, how often, and how much they spend).
By bringing these together, you get a complete picture of your store's health and can spot both problems and opportunities early.
The 7 metrics every store should track
You could track hundreds of metrics, but most successful stores focus on a handful that directly drive decisions. Here are the seven that matter most.
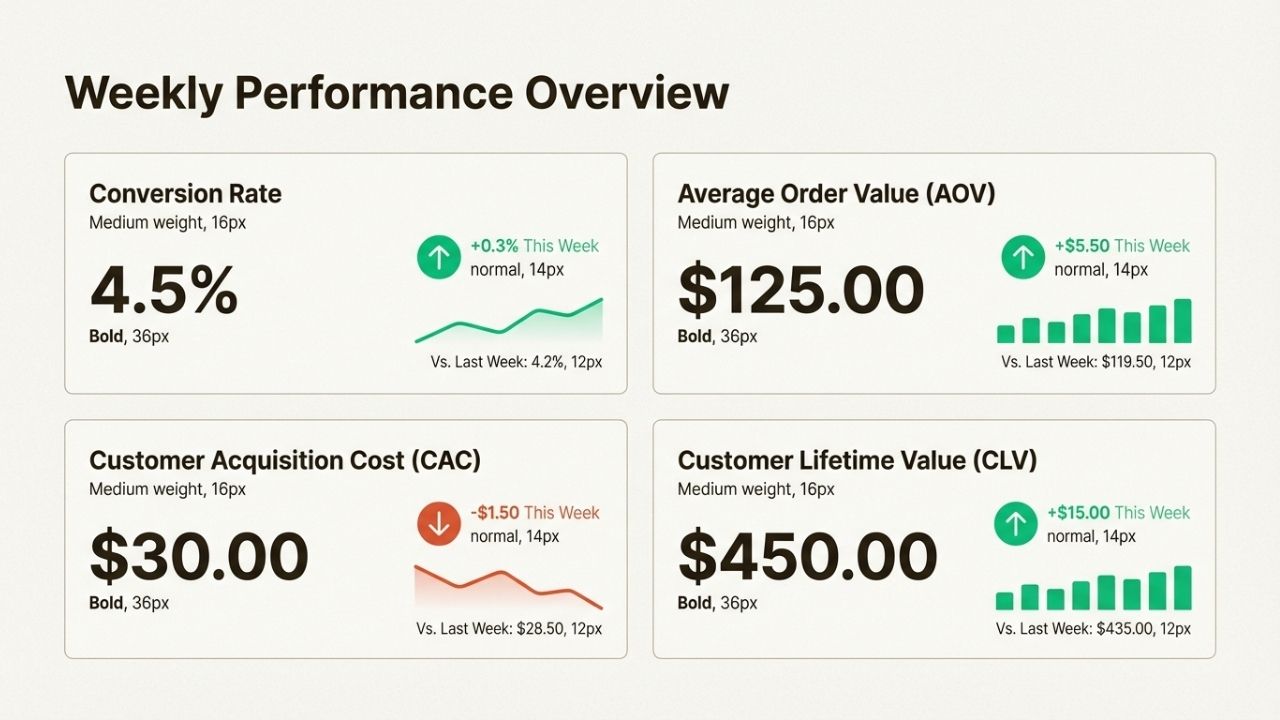
Conversion rate
Your conversion rate is the percentage of visitors who complete a purchase. Industry averages hover around 2-3%, though this varies by product category and traffic source.
A store getting 1,000 visitors per day with a 2% conversion rate makes 20 sales. Push that to 3%, and you are at 30 sales without spending a dollar more on marketing.
If your conversion rate drops, investigate your product pages, checkout flow, or traffic quality.
Sometimes the issue is technical (slow loading, broken buttons). Other times it is messaging (unclear value proposition, weak calls to action). Track this weekly to catch problems early.
Average order value (AOV)
AOV measures how much customers spend per transaction. Calculate it by dividing total revenue by number of orders.
If your store made $10,000 from 200 orders, your AOV is $50.
Raising AOV is often easier than acquiring new customers.
Common tactics include setting free shipping thresholds just above your current AOV, cross-selling related products at checkout, and bundling complementary items. Track AOV monthly and test one improvement at a time.
Cart abandonment rate
This metric shows the percentage of shoppers who add items to their cart but do not complete the purchase.
The average across ecommerce is roughly 69%, meaning nearly seven out of ten carts are abandoned.
High abandonment usually signals friction in your checkout process.
Common culprits include unexpected shipping costs, forced account creation, too many form fields, or security concerns.
Simplify your checkout, add trust badges, and send recovery emails to win back some of these lost sales.
Customer acquisition cost (CAC)
CAC tells you how much you spend to acquire each new customer. Divide your total marketing spend by the number of new customers gained in the same period.
If you spent $5,000 on ads and gained 100 customers, your CAC is $50.
Average CAC in ecommerce ranges from $45-66 depending on your industry and channels.
The key is comparing CAC to customer lifetime value. If it costs $50 to acquire a customer who spends $500 over time, you have a healthy ratio. If they only spend $60, you are barely breaking even.
Customer lifetime value (CLV)
CLV estimates the total revenue a customer will generate during their relationship with your store.
Calculate it by multiplying average order value by purchase frequency by customer lifespan. A customer who spends $50 per order, buys 4 times per year, and stays active for 3 years has a CLV of $600.
This metric shifts your focus from single transactions to long-term relationships.
Stores with high CLV can afford higher CAC because each customer brings more total value. Track CLV by customer segment to identify your most valuable audiences.
Traffic sources
Understanding where your visitors come from helps you allocate marketing budget wisely.
Most analytics platforms break this down into channels: organic search, paid ads, social media, email, direct traffic, and referrals.
The goal is not just volume but quality. A channel bringing 1,000 visitors with a 0.5% conversion rate is less valuable than one bringing 500 visitors with a 4% conversion rate.
Review your traffic sources monthly and reallocate spend toward channels that convert profitably.
Return rate
Your return rate is the percentage of orders that come back. While some returns are unavoidable (sizing issues, changed minds), high return rates often indicate problems with product descriptions, quality, or expectations.
Track return reasons if possible. If "not as described" dominates, improve your product pages.
If "defective" leads, review your quality control. Reducing return rates directly improves profitability since you keep more revenue and spend less on reverse logistics.
Essential report types for ecommerce
Different business questions require different types of reports. Here are the main categories that cover most of what you need.
Sales and revenue reports
These reports track your financial performance over time. They show total sales, revenue trends, and breakdowns by channel, product category, or time period.
Use these to understand overall business health, identify seasonal patterns, and forecast future performance.
Most ecommerce platforms include pre-built sales reports.
Start with a simple monthly revenue trend, then add comparisons (this month vs. last month, this year vs. last year) to spot changes.
Product performance reports
Product reports identify your winners, losers, and everything in between.
They typically show units sold, revenue generated, profit margins, and return rates by product or category.
Use these reports for inventory decisions. Double down on top sellers by increasing stock and featuring them prominently.
Evaluate whether to discontinue poor performers or improve their marketing. For high-return items, investigate quality or description issues.
Customer behavior reports
These reports focus on who is buying and how they interact with your store.
Key metrics include new vs. returning customers, purchase frequency, time between orders, and cohort retention (how many customers from a specific month return to buy again).
Customer behavior data drives retention strategy. Stores that know their repeat purchase rate can calculate how much to invest in loyalty programs.
Understanding which acquisition channels bring the most valuable long-term customers helps optimize marketing spend.
Marketing attribution reports
Attribution reports connect your marketing efforts to revenue. They show which channels, campaigns, and even specific ads drive sales.
This is essential for optimizing ad budgets and understanding return on ad spend (ROAS).
Most stores use a combination of platform-native reporting (Facebook Ads Manager, Google Ads) and analytics tools (Google Analytics 4) to track attribution.
The key is establishing consistent UTM parameters and conversion tracking so data flows correctly between systems.
Inventory and operations reports
Operations reports track the backend of your business: stock levels, fulfillment times, shipping costs, and return reasons.
These prevent stockouts, identify supply chain issues, and highlight opportunities to reduce operational costs.
For inventory, monitor sell-through rates (how fast products move) and days of inventory remaining.
For fulfillment, track average time from order to delivery and identify bottlenecks. These reports often get less attention than sales data but directly impact customer satisfaction and profitability.
Tools to power your reporting
The right tools make reporting faster and more actionable. Here is how to think about your options based on where you are in your business journey.
For beginners
If you are just starting, free and built-in tools cover most of your needs:
Google Analytics 4 is essential for traffic and conversion tracking. It is free, integrates with most ecommerce platforms, and provides the foundation for understanding visitor behavior.
Set up ecommerce tracking to see product performance, purchase funnels, and revenue attribution.
Native platform analytics from Shopify, BigCommerce, or WooCommerce give you order-level data without additional setup.
These show sales, products, and customers right out of the box. Start here before adding complexity.
Google Looker Studio (formerly Data Studio) lets you build free dashboards that pull data from multiple sources.
Connect your Google Analytics and ad accounts to create unified views of performance.
For growing stores
As you scale, specialized tools add capabilities:
Supermetrics pulls data from advertising platforms, analytics tools, and your store into spreadsheets or dashboards.
It saves hours of manual data gathering and reduces copy-paste errors.
Klaviyo combines email marketing with strong revenue attribution.
You can see exactly how much revenue each email campaign generates and segment customers based on purchase behavior.
Microsoft Power BI offers deeper analysis for stores with more data sources. It connects to databases, spreadsheets, and cloud services to build sophisticated reports and visualizations.
For scaling businesses
High-volume stores need enterprise-grade infrastructure:
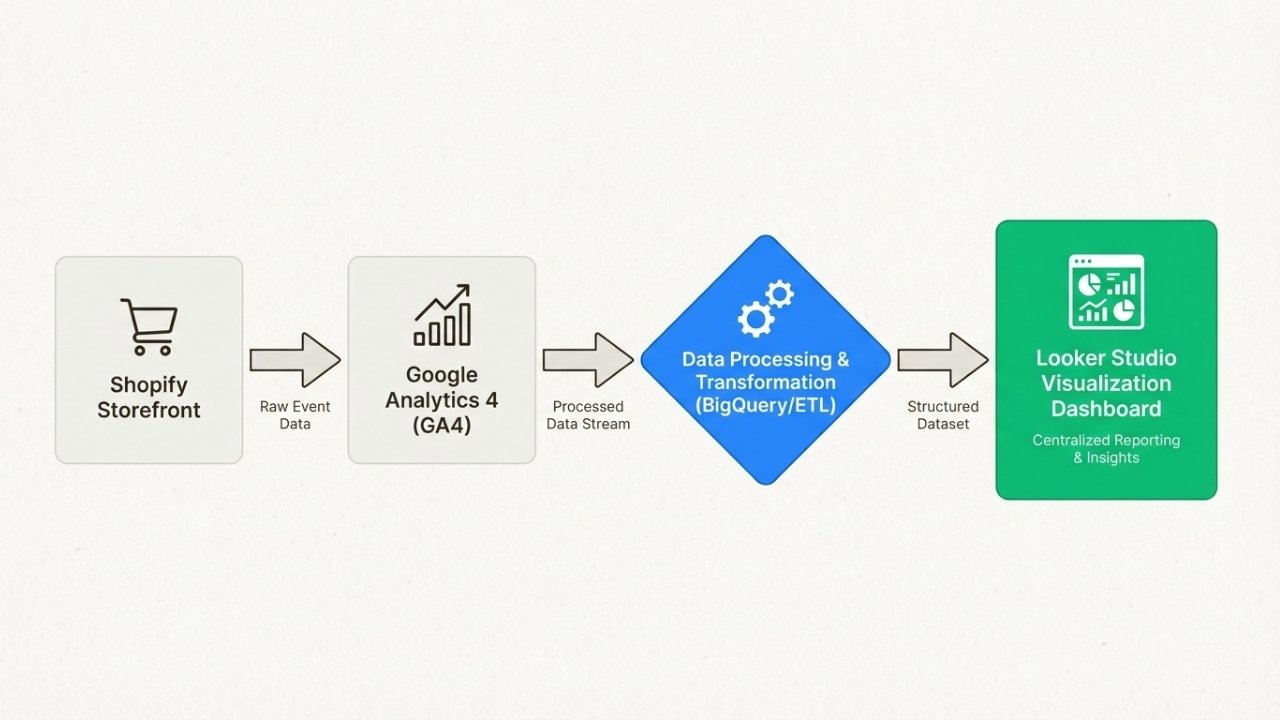
Data warehouses like BigQuery, Snowflake, or Redshift centralize data from all your systems: store platform, ad networks, CRM, inventory management.
This creates a single source of truth for analysis.
ETL platforms like Saras Daton or Fivetran automate data pipelines, moving information from source systems to your warehouse on a schedule.
This eliminates manual exports and ensures reports always show current data.
Business intelligence tools like Tableau or Looker provide advanced visualization and exploration capabilities for teams that need to dig deep into complex datasets.
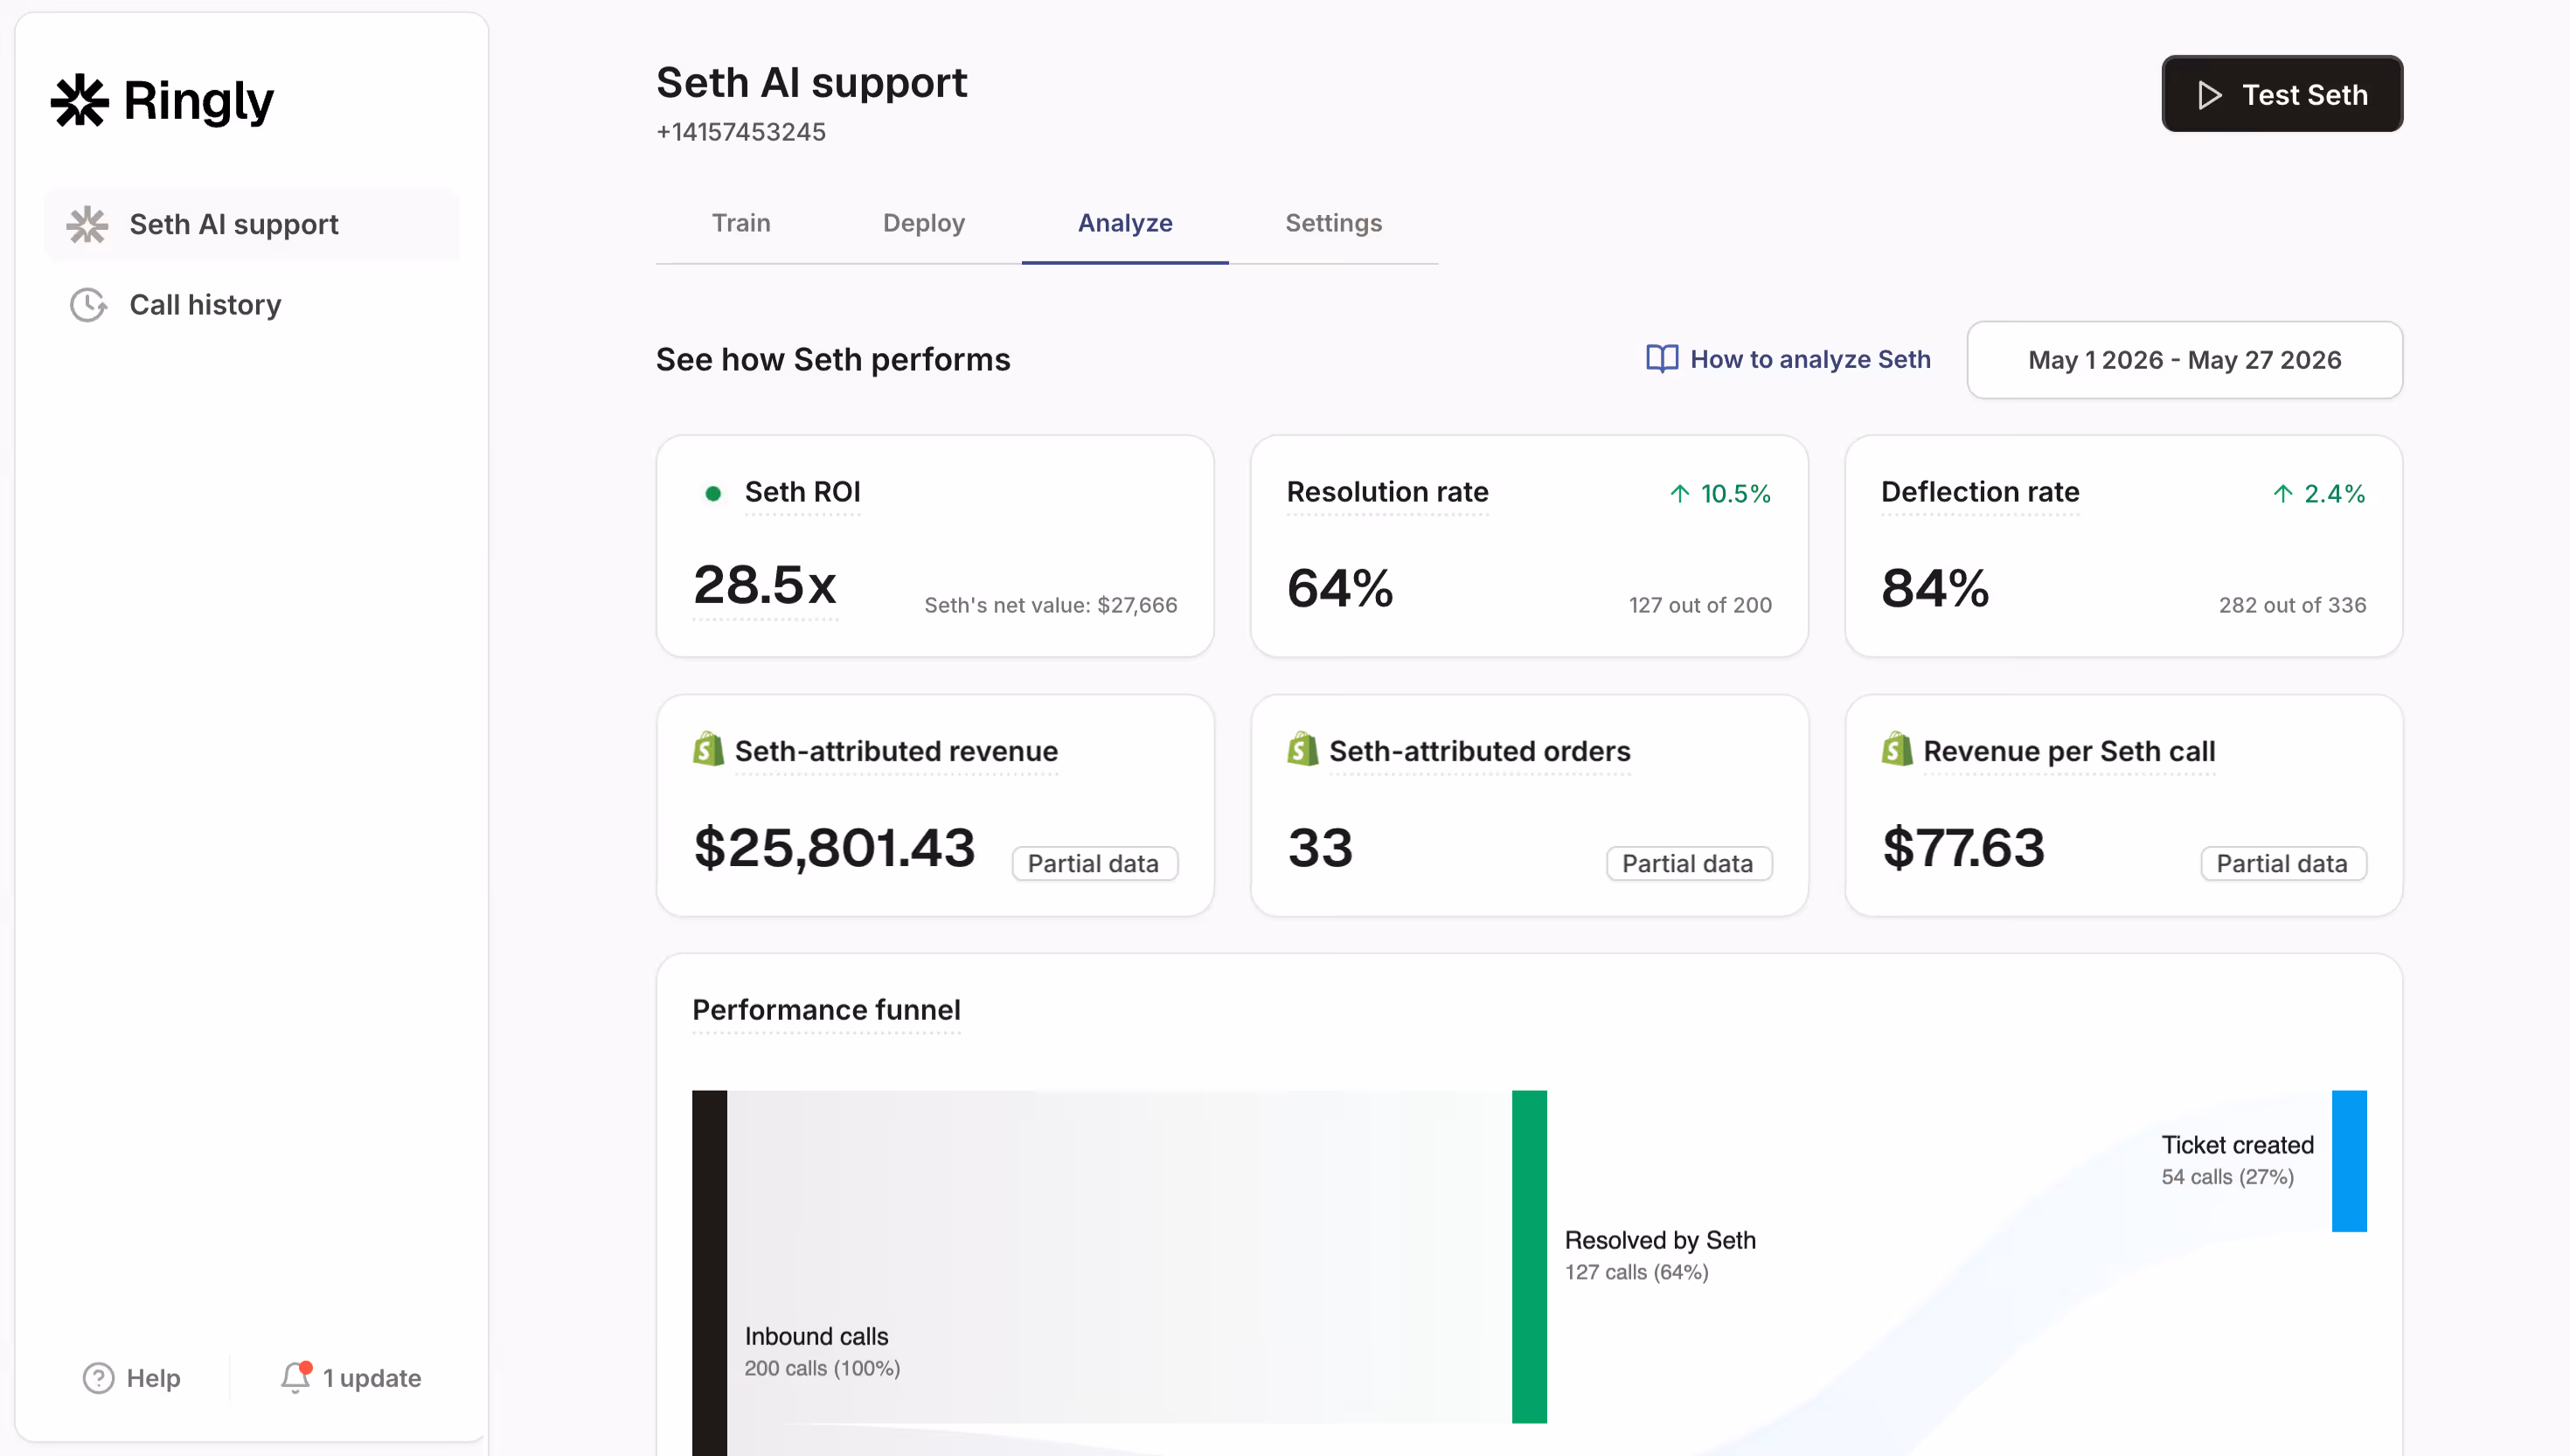
Stores using Ringly.io for AI phone support get an additional layer of reporting: call volume, resolution rates, escalation patterns, and customer sentiment from voice interactions. This complements digital analytics with insights from phone-based customer service.
Building your reporting framework
Tools and metrics are only useful if you use them consistently. Here is a practical framework for making reporting part of your operations.
Start with one question
Do not try to track everything at once. Pick one business problem you want to solve. "Why did sales drop last month?" or "Which products should we promote?" Build a report that answers that specific question. Once you are comfortable, add another.
Choose your source of truth
Decide which platform holds your primary data. For most stores, this is either your ecommerce platform (Shopify, BigCommerce) or Google Analytics 4.
Use this as your baseline and cross-reference other sources against it. Having one authoritative source prevents confusion when numbers differ slightly between systems.
Automate weekly snapshots
Set up automated reports that arrive in your inbox every Monday morning. These should show your core metrics (revenue, orders, conversion rate, traffic) compared to the previous week.
The goal is spotting trends, not analyzing every detail. Review takes five minutes, but keeps you connected to performance.
Create action triggers
Define thresholds that prompt specific actions. For example: if cart abandonment exceeds 75%, review your checkout process.
If return rate on a product hits 20%, investigate quality issues. If CAC increases 20% month-over-month, audit your ad campaigns. Triggers turn data into decisions.
Review monthly, plan quarterly
Weekly checks are for trend spotting. Monthly reviews go deeper: analyze what worked, what didn't, and why.
Quarterly planning sessions use your data to set goals and allocate resources for the next three months. This rhythm balances responsiveness with strategic thinking.
Common reporting mistakes to avoid
Even well-intentioned reporting efforts can go wrong. Here are the most common pitfalls and how to avoid them.
Tracking too many metrics
More data does not mean better decisions. When you track twenty metrics, you spread attention too thin and miss what actually matters. Focus on 5-7 KPIs that drive your business. You can always dig deeper into specific areas when questions arise.
Ignoring context
A 20% sales drop in July might be seasonal, not a crisis. A spike in traffic from a viral post might look great but convert poorly. Always compare to historical data and consider external factors before drawing conclusions.
Vanity metrics over action
Page views and social media likes feel good but rarely drive decisions. Focus on metrics connected to revenue and profit: conversion rate, AOV, CAC, and CLV. If a metric does not suggest a specific action, it is probably vanity.
Data silos
When your marketing team uses one tool and operations uses another, nobody sees the full picture. Invest in integration or regular data sharing sessions. The best decisions come from connecting insights across departments.
Analysis paralysis
Waiting for perfect data before acting is a form of procrastination. Good decisions with incomplete data usually beat delayed decisions. Start with what you have, improve over time, and remember that directionally correct insights are often enough.
Getting started: Your 30-day plan
If your current reporting consists of checking total sales occasionally, here is a practical plan to build better habits.
Week 1: Set up Google Analytics 4 ecommerce tracking and verify data accuracy. Make sure purchase events fire correctly and revenue matches your store platform within 5-10%.
Week 2: Create a simple dashboard with your five core metrics: revenue, orders, conversion rate, AOV, and traffic. Use Looker Studio or your platform's built-in reporting.
Week 3: Build one automated report, either sales by channel or product performance. Set it to email you weekly. Get comfortable reading and acting on it.
Week 4: Review your first month of data. Identify one insight that leads to action: a product to promote, a channel to adjust, or a process to improve. Document what you learned and what you will try next month.
Stores using Ringly.io can add phone support metrics to this routine. Track call volume alongside ticket volume, resolution rates alongside response times, and see how voice interactions complement your digital customer service data.
Make data-driven decisions part of your growth strategy
Ecommerce reporting is not about creating pretty charts or impressing investors with data volume. It is about making better decisions faster.
When you know which products drive profit, which channels convert, and where customers struggle, you can focus resources on what works and fix what does not.
The stores that grow consistently share one trait: they treat data as a competitive advantage.
They review metrics regularly, question assumptions with evidence, and build feedback loops that improve performance over time.
Reporting is not a one-time setup. It is a habit that compounds.
Start small, stay consistent, and let your data guide you toward smarter growth.
Ready to automate your customer support and add voice analytics to your reporting stack?
Try Ringly.io free for 14 days and see how AI phone support resolves up to 73% of calls while giving you insights into every customer conversation.
Frequently Asked Questions
What is ecommerce reporting and why does it matter?
Ecommerce reporting is the process of collecting, analyzing, and presenting data about your online store's performance. It matters because it transforms raw data into actionable insights that help you make better decisions about inventory, marketing, and customer experience.
What are the most important ecommerce reporting metrics?
The seven essential metrics are conversion rate, average order value (AOV), cart abandonment rate, customer acquisition cost (CAC), customer lifetime value (CLV), traffic sources, and return rate. These cover the core health indicators of any ecommerce business.
How often should I review my ecommerce reports?
Check key metrics weekly for trend spotting, conduct deeper monthly reviews to analyze performance, and use quarterly planning sessions to set goals based on your data. Daily checks are usually unnecessary unless you are running major campaigns.
What is the best free tool for ecommerce reporting?
Google Analytics 4 is the best free starting point. It tracks traffic, conversions, and revenue attribution. Combine it with your ecommerce platform's native analytics (Shopify, BigCommerce, WooCommerce) for a solid foundation at no cost.
How can I reduce my cart abandonment rate?
Common fixes include simplifying your checkout process, offering guest checkout, displaying trust badges, being transparent about shipping costs early, and sending abandoned cart recovery emails. Track your current rate before making changes so you can measure improvement.
What is the difference between ecommerce reporting and ecommerce analytics?
Analytics is the broader practice of analyzing data to find patterns and insights. Reporting is the specific output: the dashboards, charts, and summaries that communicate those insights. You need analytics to generate reports, and reports to share analytics with your team.