

This post in 30 seconds.
- The map of every report inside Gorgias Insights: Live, Support Performance, Ticket Insights, AI Agent, Revenue, and Voice, plus how to read the metrics that actually move decisions.
- Two things almost nobody catches: Gorgias reports the median (not the average) for response and resolution time, and Revenue statistics only counts Shopify orders, only on Pro and up.
- Built for founders, COOs, and Heads of CX at $10M to $100M Shopify brands running a paid helpdesk with a visible phone number.
Most Heads of CX open Gorgias Insights to answer one question their founder keeps asking: what's our resolution rate, and is support actually paying for itself. For email and chat, the answer is right there. For the phone, it usually isn't. That gap is the reason this post exists.
Gorgias Insights (officially the Statistics area inside Gorgias) is genuinely good reporting for a Shopify helpdesk. We run AI phone support alongside Gorgias for Shopify brands every day, so I read these dashboards constantly, not as a critic, as someone who lives next to them. This is the honest field guide: what's in there, how to read it, what's gated behind a higher plan, and the one channel it structurally can't see. If you run a $10M to $100M Shopify brand and your phone backlog never shows up in any of these numbers, book a 30-min call and we'll map what's missing.
What's inside Gorgias Insights
Gorgias splits reporting into six areas. Knowing which report answers which question saves you from building dashboards you don't need.
| Report area | What it answers | Notes |
|---|---|---|
| Live | What's happening right now | Agents online, open ticket counts, hourly volume. Refreshes every 5 min. |
| Support Performance | How good was support over a period | FRT, resolution time, CSAT, volume, one-touch |
| Ticket Insights | What kinds of tickets are these | Breakdowns by fields, tags, macros, intents |
| AI Agent | What did automation handle | Resolved conversations, flows, order management |
| Revenue | Did support drive sales | Conversion ratio, sales from support (Pro and up) |
| Voice | Call activity | Add-on only. Limited history, no abandonment metric |
On top of the pre-built reports, you can build custom dashboards from a library of 70+ metrics, capped at 10 dashboards with 20 charts each. You can filter by tag, channel, ticket field, or agent, save a default view, and export any dashboard to CSV. Only Admins and Leads can build them. Everyone else can look.
The fastest win here is the channel breakdown, because it tells you where your volume is actually coming from before you staff for it. The default period is the last 7 days, the max range is a year, and deleted, merged, trash, and spam tickets are stripped out so they don't pollute the counts.
How to actually read the core KPIs
This is where most teams misread their own data, and it's a quiet one.
Gorgias reports first response time and resolution time as the median, not the average. It does that on purpose, to stop one ticket that sat open for a month from dragging the whole number up. That's the right call statistically. But if you've been reading that 4-hour figure as an average and budgeting staff around it, you're working off a different number than you think. Half your tickets are slower than the median. The tail is invisible.
Here's how to read the four that matter:
- First response time (FRT). How long a customer waits for a human. It excludes rule-generated auto-replies, external email, and agent-initiated tickets, so it reflects real wait, not automation noise. Gorgias's own benchmark data puts the median FRT at 6.3 hours across industries, swinging up to 5.5x by vertical.
- Resolution time (RT). First customer message to ticket close. It includes time outside business hours, so an overnight ticket carries that overnight gap. Good to know before you celebrate a low number.
- CSAT. A 1 to 5 score. Gorgias benchmarks land between 4.45 and 4.66 out of 5, so anything under 4.4 is worth a look.
- One-touch tickets. The share closed with exactly one agent reply. This is your cleanest proxy for "how much of our volume is just the same simple question over and over."
That last one is the number to watch. If 60% of your tickets are one-touch, most of your team's day is repeatable work, the kind that doesn't need a person. For context on the routine side, our breakdown of WISMO calls covers where the bulk of it comes from, and our wider take on ecommerce customer service puts the metrics in context. Industry-wide, "where's my order" runs 30 to 50% of all support tickets, higher at peak.
Ticket Insights, the AI Agent report, and a dashboard worth keeping
Two reports get skipped because they sit lower in the menu, and they're the two that change how you staff.
Ticket Insights breaks your volume down by fields, tags, macros, and intents. In plain terms, it tells you what your tickets are about, not just how many there are. If you've tagged well, this is where you find out that 40% of your week is returns and another 25% is order status. That's the difference between "we're busy" and "we're busy doing four things." Tag discipline is the price of admission. Without it, this report is noise.
The AI Agent report shows what automation actually closed: resolved conversations, the flows that ran, and order-management actions. Gorgias's own benchmark data puts the median AI self-service resolution rate at 45%, with the top quartile at 65%. If your AI Agent is sitting well under 45%, the report is telling you the knowledge base needs work, not that automation doesn't work for you.
When you go to build a custom dashboard, resist the urge to chart everything. A dashboard worth keeping has four or five tiles, not twenty:
- Volume by channel. Where the work comes in, so you staff the right queue.
- One-touch rate. Your repeatability signal, trending week over week.
- Median FRT and RT. The two SLA numbers your founder asks about.
- CSAT, filtered to low scores. A recovery list, not a vanity metric.
- Tickets by top tag. What you're actually spending the week on.
Most teams over-build dashboards and then never look at them, because a 20-chart wall answers no specific question. Build the one that answers "where is the team's time going, and is it the work we want them doing." For the bigger picture on how these numbers should hang together, our guide to ecommerce customer service KPIs is a cleaner starting point than charting from scratch.
Revenue statistics, and what it's really counting
The report founders care about most is the one that's locked behind a plan. Gorgias Revenue statistics shows tickets converted, conversion ratio, total sales from support, sales per day, and sales per agent. It's the closest thing to proving support pays for itself.
Two things to know before you quote that number in a board deck.
First, it's gated. Revenue statistics only exists on Pro, Advanced, and Enterprise, which starts at $300/mo, and it requires a connected Shopify store. On Starter or Basic you get Support Performance only. Our Gorgias pricing breakdown walks the full tier map if you're deciding where to land.
Second, the attribution is narrower than it looks. A sale counts only if the same email is on both the ticket and the order, the order is positive and paid, and the purchase lands within 3 days of the ticket being created. Refunded orders get pulled back out, and the sale is credited to whichever agent was assigned at the time. It's a clean rule. It's also why a lot of real revenue never shows up: anything that closed on a channel Gorgias didn't ticket, or outside that 3-day window, is gone from the number.
Worth comparing against your other tools here, because ecommerce dashboards rarely agree on attribution. If you want to pressure-test what your support is actually driving, book a 30-min call and we'll do the math live against your own numbers.
The blind spot: your phone channel
Now the part the SERP doesn't tell you. Gorgias Insights is email, chat, and ticket reporting. The phone is barely in it.
Gorgias does have a Voice product, but it's a paid add-on billed per call ticket, and the reporting is thin. The Voice Overview report gives you total, inbound, outbound, and missed calls plus average wait and talk time. But the data only filters from November 20, 2023 onward, and there's no abandonment-rate metric at all, the single number that tells you how many callers hung up before anyone picked up.
And here's the bigger issue. If your phone runs on a separate system, or on an AI voice agent that sits outside the helpdesk, none of it lands in Insights. Not the call volume. Not resolution. Not the revenue a call recovered. The Revenue statistics report is tied to Shopify orders matched to tickets, so a phone order that never became a Gorgias ticket simply doesn't exist in your reporting.
That matters because the phone is still where a lot of your customers go. Nearly 70% of Americans use phone support, even though only about a third say they prefer it. You can have a beautiful Gorgias dashboard and still be blind to the channel where your highest-intent, most frustrated customers are calling.
"My customers also feel like it's a normal person. They feel like they can communicate if they have questions."
Claudia Droge, TechCraft Studio
How to add the phone channel to the picture
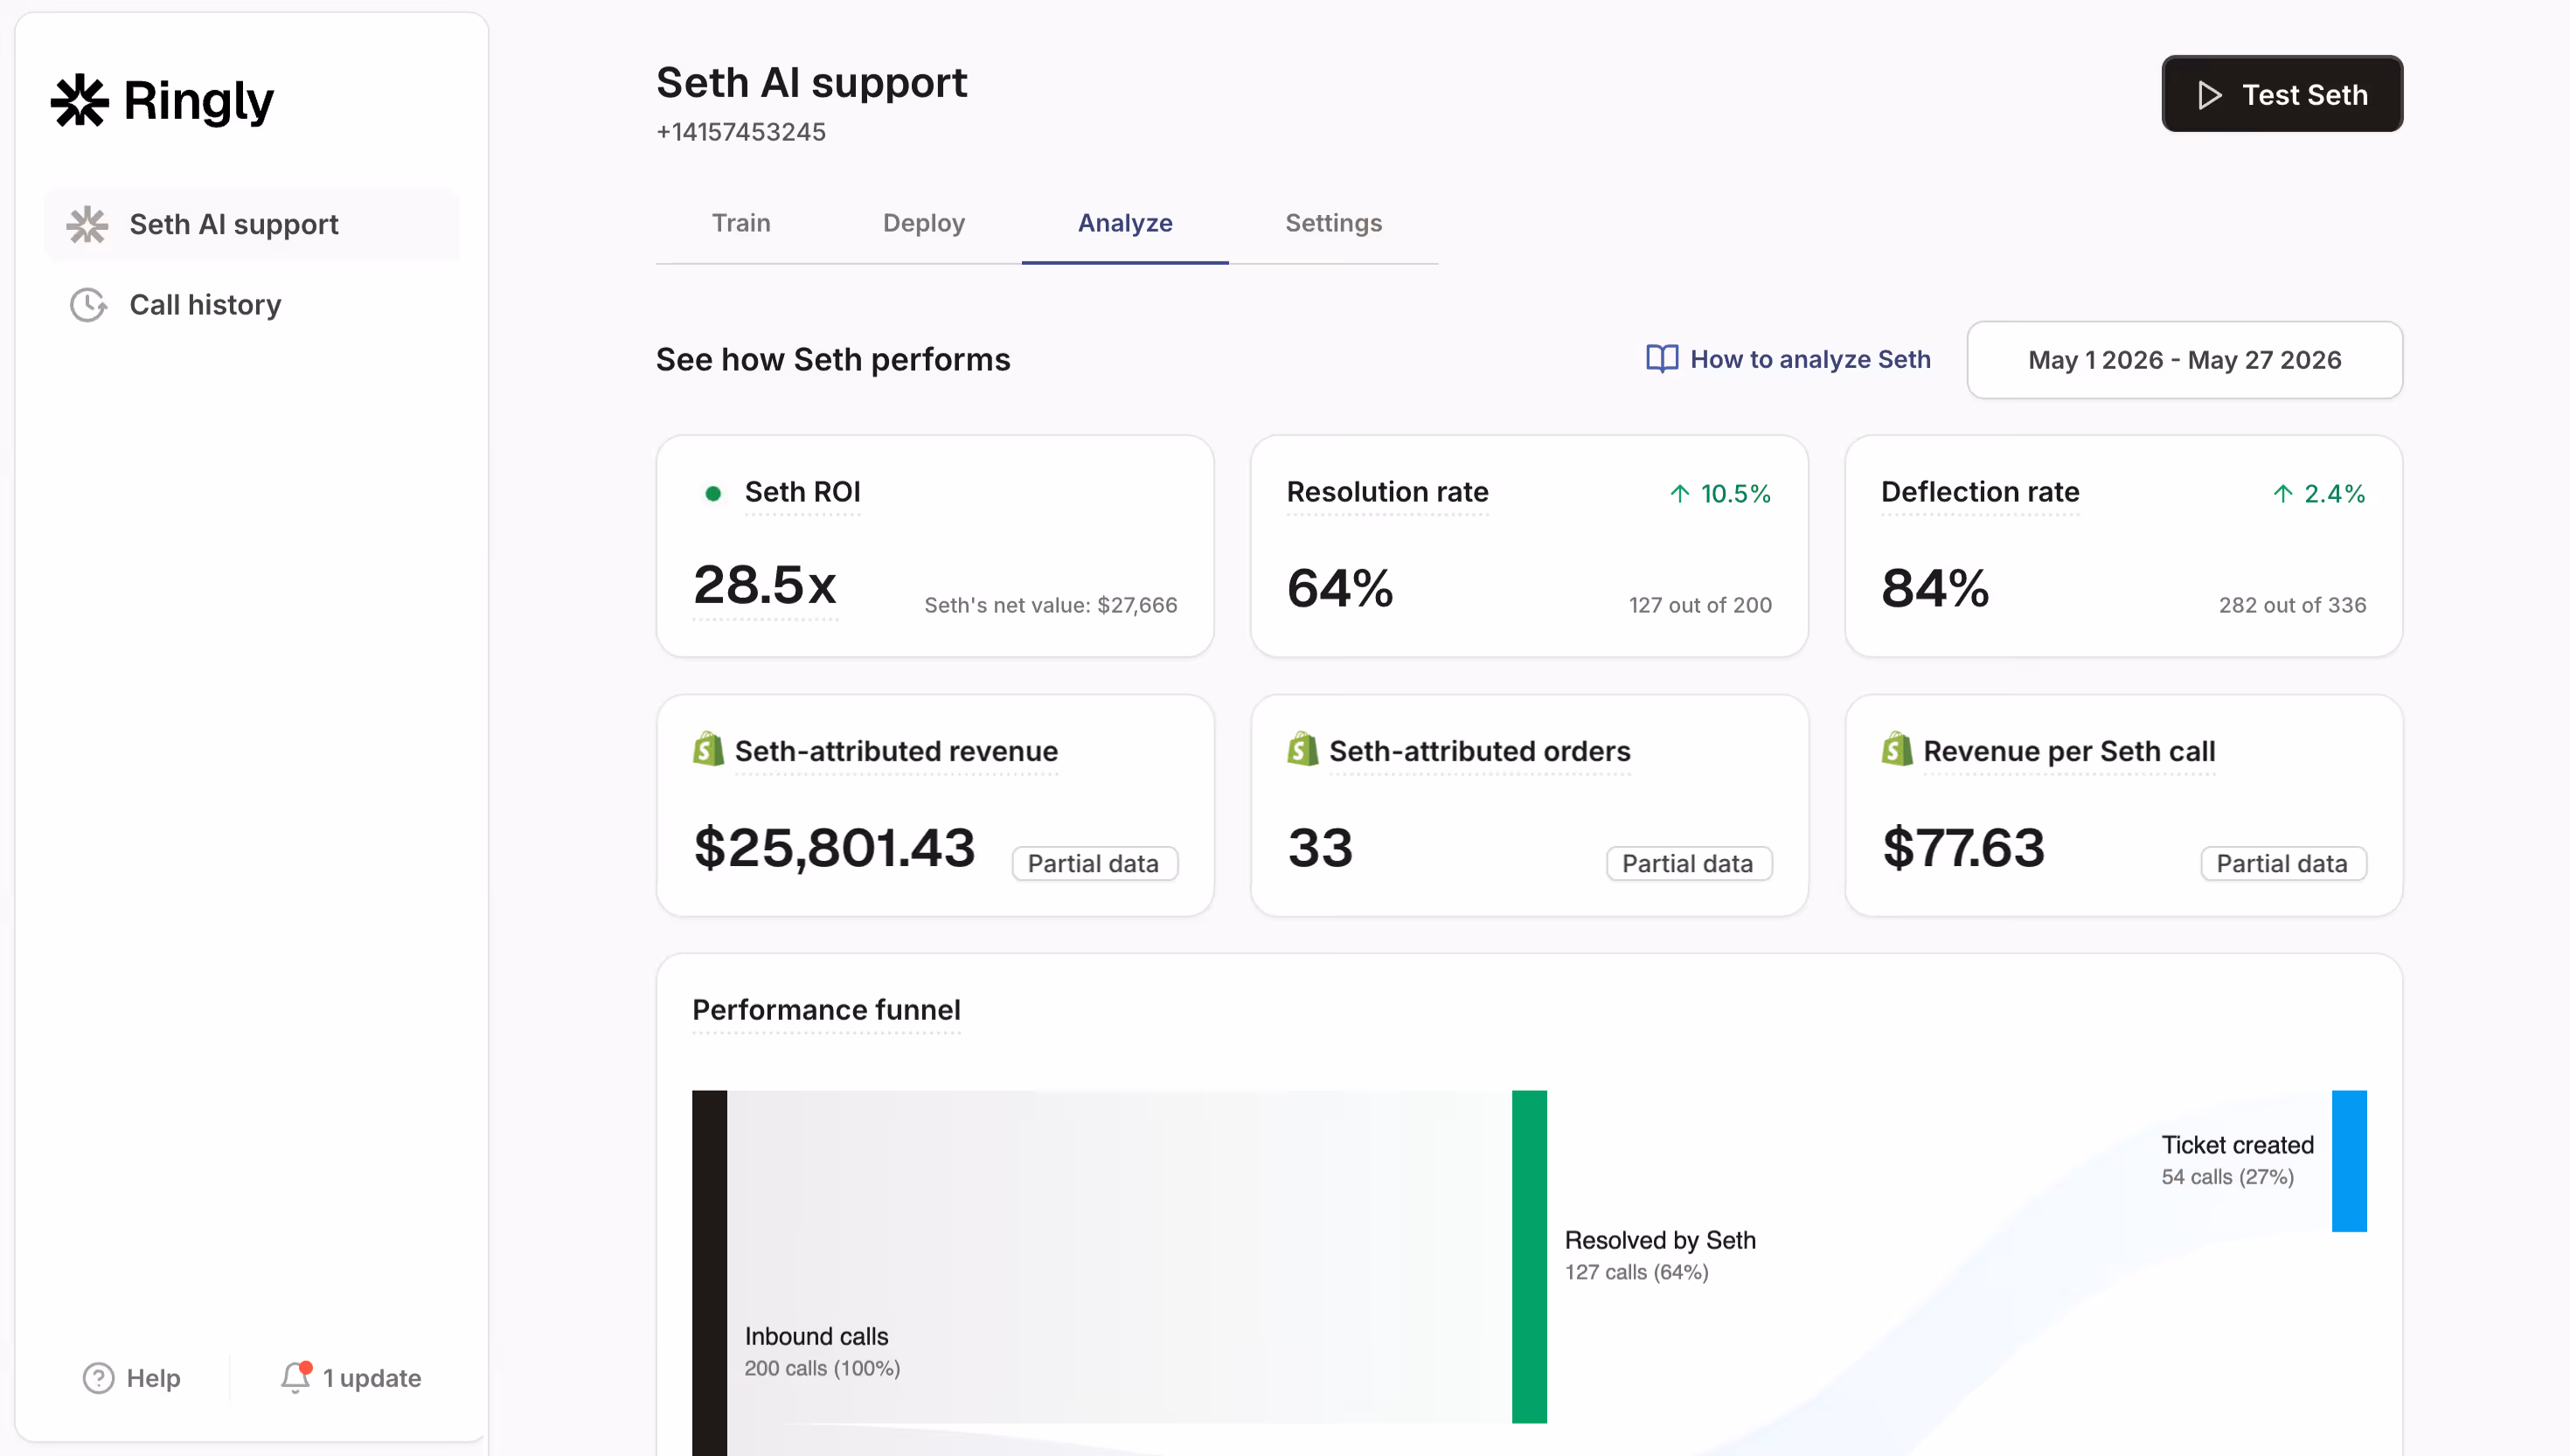
Ringly.io is AI phone support for Shopify brands. The reason it's relevant to a post about Gorgias Insights is simple: it reports on the channel Gorgias can't, and it escalates the rest cleanly into Gorgias.
Instead of hiring and training a phone team, the AI answers inbound calls 24/7. It finds orders in your Shopify store, processes returns and exchanges, answers product questions from your knowledge base, and rescues abandoned carts. It's a purpose-built Shopify customer service app for the phone. Across 50+ brands, the AI resolves 73% of calls autonomously at roughly $0.42 per resolved call. Calls that need a human escalate cleanly to Gorgias, Richpanel, Reamaze, or whatever helpdesk you already run, so your team keeps one inbox.
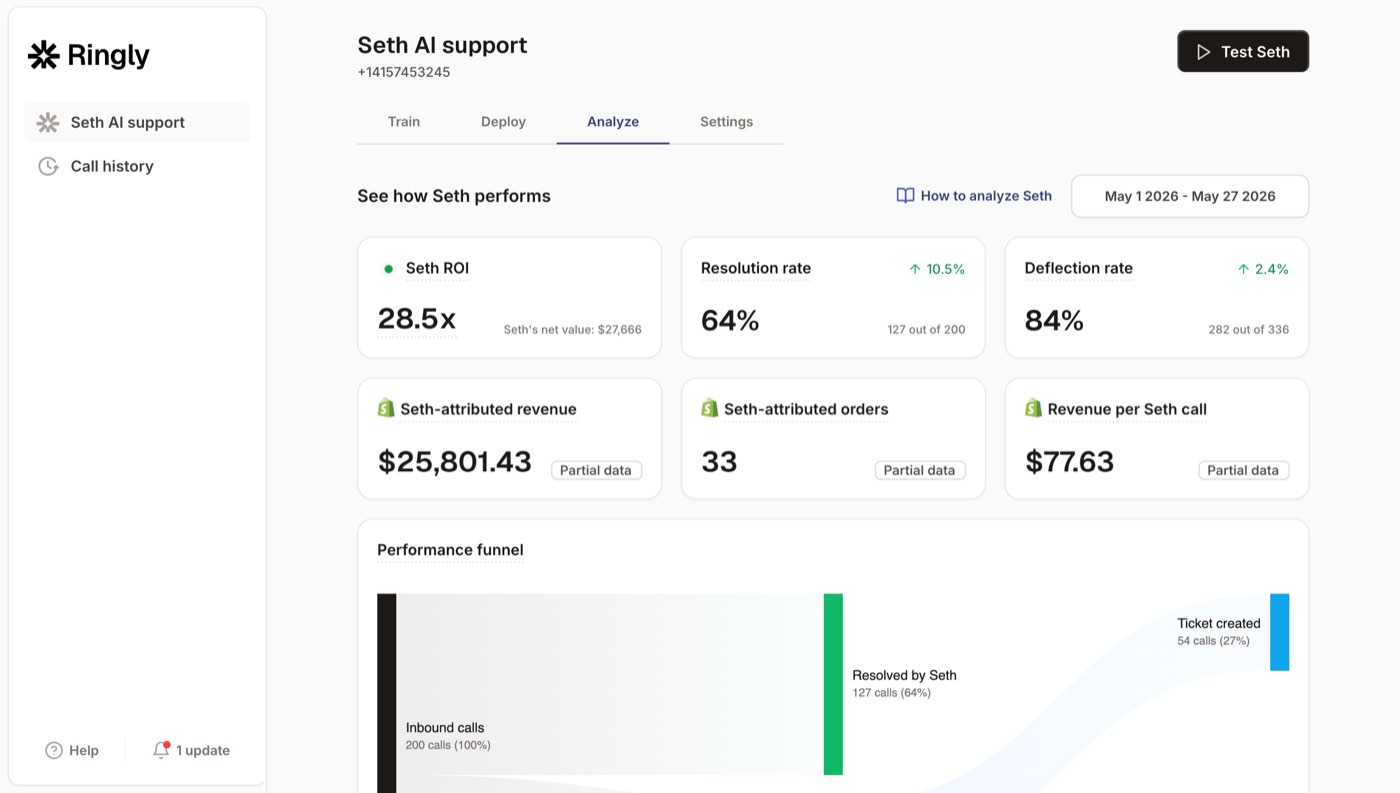
The difference in your reporting: phone call volume, resolution, transfer rate, and recovered revenue all show up, on the dashboard, by call. WashCo, a Shopify brand we launched, recovered $22,664 in its first 7 days on the phone, the kind of number that never reaches a Gorgias Revenue chart because it happened on a call. Our AI call analysis breaks every conversation down the way Insights breaks down tickets.
Here's the cost side, which is usually the real reason a founder is staring at Insights in the first place. Take a typical $50M Shopify brand running a 6-rep CS team:
| Line item | Today | With Ringly |
|---|---|---|
| 6 reps x $4K loaded per rep | $24,000/mo | n/a |
| Ringly (~$5K/mo) | n/a | $5,000/mo |
| Net monthly CS spend | $24,000/mo | $5,000/mo |
| Monthly savings | n/a | $19,000/mo |
| Annual savings | n/a | $228,000/yr |
That's roughly 70% of repeatable calls (order status, returns, the same five questions over and over) routed to the AI. The other 30%, the genuinely complex calls, still go to your team, who now have time to actually solve them. If you want to see how this works without a phone team at all, our guide on scaling customer service without hiring maps the playbook, 24/7 ecommerce phone support covers the after-hours math, and ecommerce phone support lays out the full case.
Plans: Grow $349/mo (1,000 minutes), Pro $799/mo (2,500 minutes), Enterprise custom. Live in under an hour. 65% resolution guarantee: if the AI resolves under 65% of your calls in 90 days, we refund the last 3 months.
Frequently asked questions
What is Gorgias Insights?
Gorgias Insights is the reporting and analytics area inside the Gorgias helpdesk, officially called Statistics. It covers six report areas (Live, Support Performance, Ticket Insights, AI Agent, Revenue, and Voice) plus custom dashboards built from 70+ metrics.
Is Gorgias reporting available on every plan?
Support Performance and custom dashboards are on every Helpdesk plan, including Starter. Revenue statistics is locked to Pro and up ($300/mo) and needs a connected Shopify store, and automation reporting needs Advanced with the AI Agent.
Does Gorgias report on phone calls?
Only if you pay for the Voice add-on, and even then the reporting is limited. There's no abandonment-rate metric, and the data only filters from November 2023 onward. Any phone system or AI voice agent running outside Gorgias is invisible to Insights.
Why does Gorgias use median instead of average for response times?
Gorgias uses the median for first response time and resolution time to stop a few extreme tickets from skewing the number. It's more honest about the typical case, but it means half your tickets are slower than the figure you see, so don't read it as an average.
How does Gorgias attribute revenue to support?
A sale counts when the same email is on both the ticket and a paid Shopify order placed within 3 days of the ticket being created. It's credited to the assigned agent, and refunded orders are removed. Sales outside that window or on un-ticketed channels don't appear.
Can I see phone revenue and resolution in one place with Gorgias?
Not for an external phone channel. If you run AI phone support like Ringly, call volume, resolution, and recovered revenue report on the Ringly dashboard, and calls that need a human escalate into Gorgias so your team keeps one inbox.
Talk to us

If you run a $10M to $100M Shopify brand and your phone channel never shows up in Gorgias Insights, a 30-min call is the fastest way to see what you're not measuring, and what it's costing.
The 3-layer guarantee.
- Live in 14 days or it's free until launched.
- 65% resolution in 90 days or we refund the last 3 months of subscription fees.
- We keep working free until we hit 65%.
Ruben (Ringly co-founder) takes these calls personally.