
Gorgias gives you 70+ metrics. You need about six of them.
- The five report families inside Gorgias, what each one is for, and how the core numbers (FRT, resolution time, CSAT, one-touch) are actually calculated.
- The dashboards worth building if you run support, plus a 15-minute Monday routine you'll actually keep.
- The one channel Gorgias reporting can't see, and why that gap costs real money. Written for the founder, COO, or Head of CX at a $10M-$100M Shopify brand running a paid Gorgias plan.
Every Monday your founder asks the same question: "what's our resolution rate trending?" And if you run support at a growing Shopify brand, you've sat in that standup without a clean answer, because the number is split across Gorgias, Shopify, and a spreadsheet your lead rep keeps by hand. Gorgias reporting is supposed to end that. It mostly can. The catch is that it hands you 70-plus metrics and almost no guidance on which six matter or what to do when one moves.
I've read a lot of real Gorgias dashboards over the last year, and the brands that get value from reporting all do the same thing: they ignore most of it. This is the operator's version of the guide, not the docs version. It covers the reports you have, how to read each number without fooling yourself, the dashboards worth building, a routine that takes 15 minutes, and the blind spot nobody warns you about until it's already cost you orders. If you want to skip ahead and have us look at your numbers with you, you can book a 30-min call.
Most teams at $10M-$100M on Shopify run Gorgias, a visible phone line, and a CS team of three to twelve reps drowning in the same questions over and over. This guide is for the person who owns that queue and has to report on it. If your reporting is fine on email and chat but you can't see what's happening on the phone, the last section is the one to read. Book a 30-min call and we'll go through your missed-call data live.
In this post:
Where Gorgias reporting lives and what's inside it
You get to all of it from one place. From the helpdesk, click the dropdown in the top-left corner and select Analytics. That's the whole front door.
Inside, Gorgias splits reporting into five families, and knowing which one to open saves you most of the confusion.
- Live statistics. A real-time view of ticket volume and what each agent is working on right now. This is your staffing-and-triage screen, not your reporting screen. Open it when the queue feels heavy and you need to know if it's real.
- Support performance. The historical workhorse. Team, agent, and channel numbers over a date range. This is where "how did we actually do last week" lives.
- Satisfaction (CSAT). Survey results, scored and trended. Gorgias's CSAT 2.0 reports the Satisfaction Score, the percentage of 4 and 5-star ratings, and lets you break it down by agent, contact reason, and channel (Gorgias product updates).
- AI Agent report. How Gorgias's own automation is doing: automation rate and AI-resolved tickets. Useful if you pay for it, irrelevant if you don't.
- Custom dashboards. Where you build your own views by mixing and matching the full metric library.
The custom dashboards are the part most teams underuse, and they're the part that earns its keep. You can create up to 10 dashboards, each holding up to 20 charts, drawn from 70-plus metrics (Gorgias docs). Charts come in three shapes: KPI cards for a single headline number, graphs (bar, line, donut) for trends, and tables for the detail underneath. You can filter any of it by period, channel, agent, tag, ticket field, or integration, and save the filter combinations you reuse.
When you need the raw data somewhere else, every chart exports. Go to Actions and choose Download Data, and you get a CSV named by dashboard, chart, and date. For ticket-level detail, the account owner, admins, and leads can export tickets from any view or from an analytics drill-down, and Gorgias emails you a download link that stays live for 14 days (Gorgias docs). That export path matters more than it looks, because Gorgias reporting is strong inside its own walls and weak the moment you need a number it doesn't natively show. More on that later.
The metrics that actually matter, and how each is calculated
Here's where most guides just list 70 metrics and leave. The useful move is the opposite: pick the handful that drive decisions, and understand exactly how Gorgias computes them, because a few of them lie if you read them wrong.
Six numbers carry almost all the signal for a DTC support team. Everything else is a drill-down you open when one of these six moves.
| Metric | What it tells you | How Gorgias calculates it |
|---|---|---|
| First response time (FRT) | How long a customer waits before a human replies | Median time from ticket creation to first agent reply. Counts hours outside business hours |
| Resolution time | How long a problem actually takes to close | Median time from the first customer message to the final close of the ticket |
| Closed tickets (and % closed) | Throughput, how much your team is clearing | Total tickets closed in the window |
| One-touch tickets | Quality and efficiency, how often you solve it in one go | Single-message closed tickets divided by total closed, times 100 |
| Satisfaction Score (CSAT) | How customers feel about the help they got | Percentage of 4 and 5-star survey responses in the period |
| Ticket volume (created vs closed) | Whether you're keeping up or falling behind | Count of tickets created against tickets closed |
A few calculation details change how you read these.
- FRT and resolution time are medians, not averages. Gorgias uses the median on both to keep one nightmare ticket from skewing the whole report (Gorgias docs). This is the right call, but it trips people up. If your median resolution time looks great and the floor still feels on fire, you're feeling the tail the median is hiding. Open the drill-down and look at the slow end.
- FRT excludes a lot on purpose. Rule-generated auto-replies don't count, replies your reps send straight from Gmail instead of the helpdesk don't count, and tickets an agent starts themselves don't count. So if your reps work around Gorgias, your FRT will look worse than reality. That's a process fix, not a reporting one.
- One-touch is the most underrated number you have. A high one-touch rate means your team is closing routine tickets cleanly the first time. When it drops, something got harder: a confusing policy, a product issue, a knowledge-base gap. It's an early warning that shows up before CSAT does.
- Resolution time needs at least one customer message and one agent or rule reply to count, and it ignores tickets reopened inside the period. Useful to know before you panic about a number that excluded half your reopens.
Ticket volume deserves a specific habit. Don't read created tickets alone, read created against closed. If created is outrunning closed for more than a few days, your backlog is growing whether or not it feels like it yet. That gap is the single most honest leading indicator in the whole tool, and WISMO ("where's my order") is usually what's driving it, since it runs 30-40% of tickets in a normal week and over half at peak (Salesforce).
The dashboards worth building as a support lead
The 70-metric library is overwhelming until you decide what questions you're actually answering. Build dashboards around questions, not metrics. Gorgias publishes seven recipe ideas (Gorgias blog); in practice a DTC lead needs about four.
A daily pulse, a backlog check, a CSAT recovery view, and a returns lens cover 90% of what you'll actually look at.
- Daily pulse. One dashboard, KPI cards only: open tickets, created vs closed today, FRT, CSAT this week, and busiest hours. This is the screen you glance at with coffee. No graphs, no tables, just the five numbers that tell you if today is normal.
- Backlog health. Created vs closed over 30 days, open tickets by age, and handle time. This is where a slow leak shows up. If the created line has been above the closed line for two weeks, you have a staffing or automation decision to make before peak season makes it for you.
- CSAT recovery. Filter to 1 and 2-star ratings, then pull resolution time, FRT, messages per ticket, and the comment highlights on those tickets. Low scores almost always trace back to a slow or many-touch resolution. This dashboard tells you which one.
- Returns and refunds. Filter to the "Return" contact reason and look at ticket-field top values plus resolution time. Reading return reasons in aggregate, month over month, is how you stop a product or sizing problem at the source instead of staffing up to absorb the calls about it. It's worth pairing with your broader customer service KPIs for ecommerce so the support read and the product read sit side by side.
Pin the daily pulse as your default so it's the first thing Gorgias shows you. Keep the other three one click away. That's the whole system. Resist the urge to build all ten dashboards, because a dashboard you don't read every week is just a chart graveyard.
A reporting routine you'll actually keep
A dashboard is worthless without a habit attached to it. The brands that actually run on their numbers don't stare at reports all day. They have a short routine and stick to it.
Fifteen minutes on Monday and one longer review a month beats a dashboard you open in a panic.
The Monday read, 15 minutes:
- Open the daily pulse and the backlog health dashboard.
- Read five numbers: FRT, resolution time, CSAT, one-touch rate, and created-vs-closed for the last 7 days.
- For each, ask one question: better or worse than last week? You're hunting for direction, not precision.
- If one moved more than a little, open that metric's drill-down for two minutes. If nothing moved, close the tab. A flat week is a good week.
The monthly review, 45 minutes:
- Pull the full month on support performance, broken down by agent and by channel.
- Read your returns dashboard and write down the top three return reasons. Send them to whoever owns product.
- Check your CSAT response rate, not just the score (more on why in a second).
- Decide one thing: what's the single change that would move next month's numbers? Then make it. One change, measured.
The "when a number moves" trigger is the third piece. If one-touch rate drops or created starts outrunning closed, don't wait for Monday. Those two are your early-warning system, and they tend to move before first call resolution and CSAT catch up. The whole point of reporting is to act earlier than you would on gut, and a routine is what turns a dashboard into action instead of decoration. If you've never set service targets to read against, a simple SLA framework gives the numbers something to mean.
What Gorgias reporting can't see
Gorgias reporting is good. But it has edges, and a couple of them are the kind that make a clean-looking dashboard quietly misleading. These are worth knowing before you bet a quarter's staffing plan on a number.
The most expensive blind spot in Gorgias reporting is the phone, and it doesn't announce itself.
First, the smaller traps. Gorgias reports are built for data inside Gorgias, so any cross-stack view (support cost against revenue, tickets against Shopify cohorts) needs a third-party BI tool like Geckoboard or Daasity, or a CSV export and a spreadsheet. And watch your CSAT response rate, not just the score. A 95% Satisfaction Score on an 8% response rate isn't a 95%, it's a guess from your happiest 8%. Read the score and the response rate together or don't trust the score.
Then the big one. If your highest-intent, most frustrated customers call you, Gorgias reporting probably can't see most of what happens on that line.
- There's no call abandonment-rate metric, even on the paid Voice add-on. The number that tells you how many callers gave up on hold simply isn't there.
- Voice data only filters from November 2023 onward, so historical phone trends are thin.
- The Revenue statistics report only counts Shopify orders matched to a Gorgias ticket. A customer who calls, asks a question, and then orders, where the call never became a ticket, shows up nowhere. The revenue is real; the report says zero.
- If your phone runs on a separate system, or on an AI phone agent that sits outside the helpdesk, none of it lands in Gorgias: not call volume, not resolution, not the revenue a call recovered. You can have a beautiful Gorgias dashboard and be completely blind to the channel where the angriest customers show up. We wrote a deeper breakdown of what Gorgias Insights actually shows you if you want the full picture.
This isn't academic. Nearly 70% of Americans still use phone support, and 85% of callers who can't reach a person never call back, with 62% switching to a competitor (PCN Answers). The calls you can't see in your reporting are the ones costing you the most.
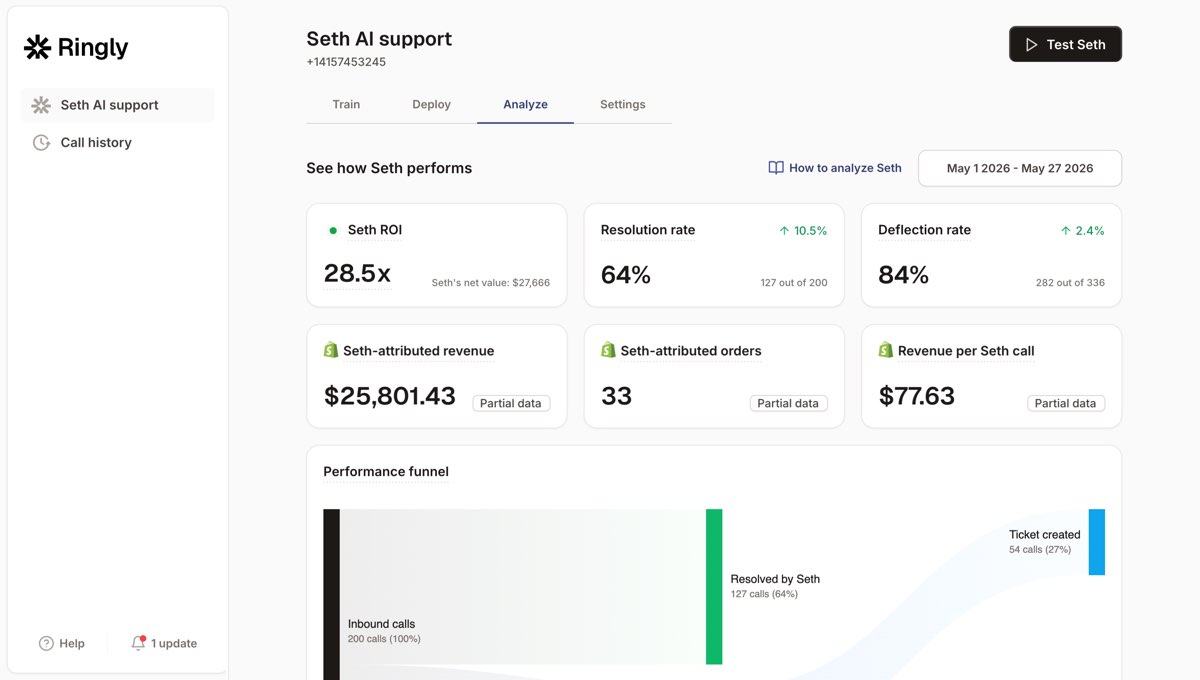
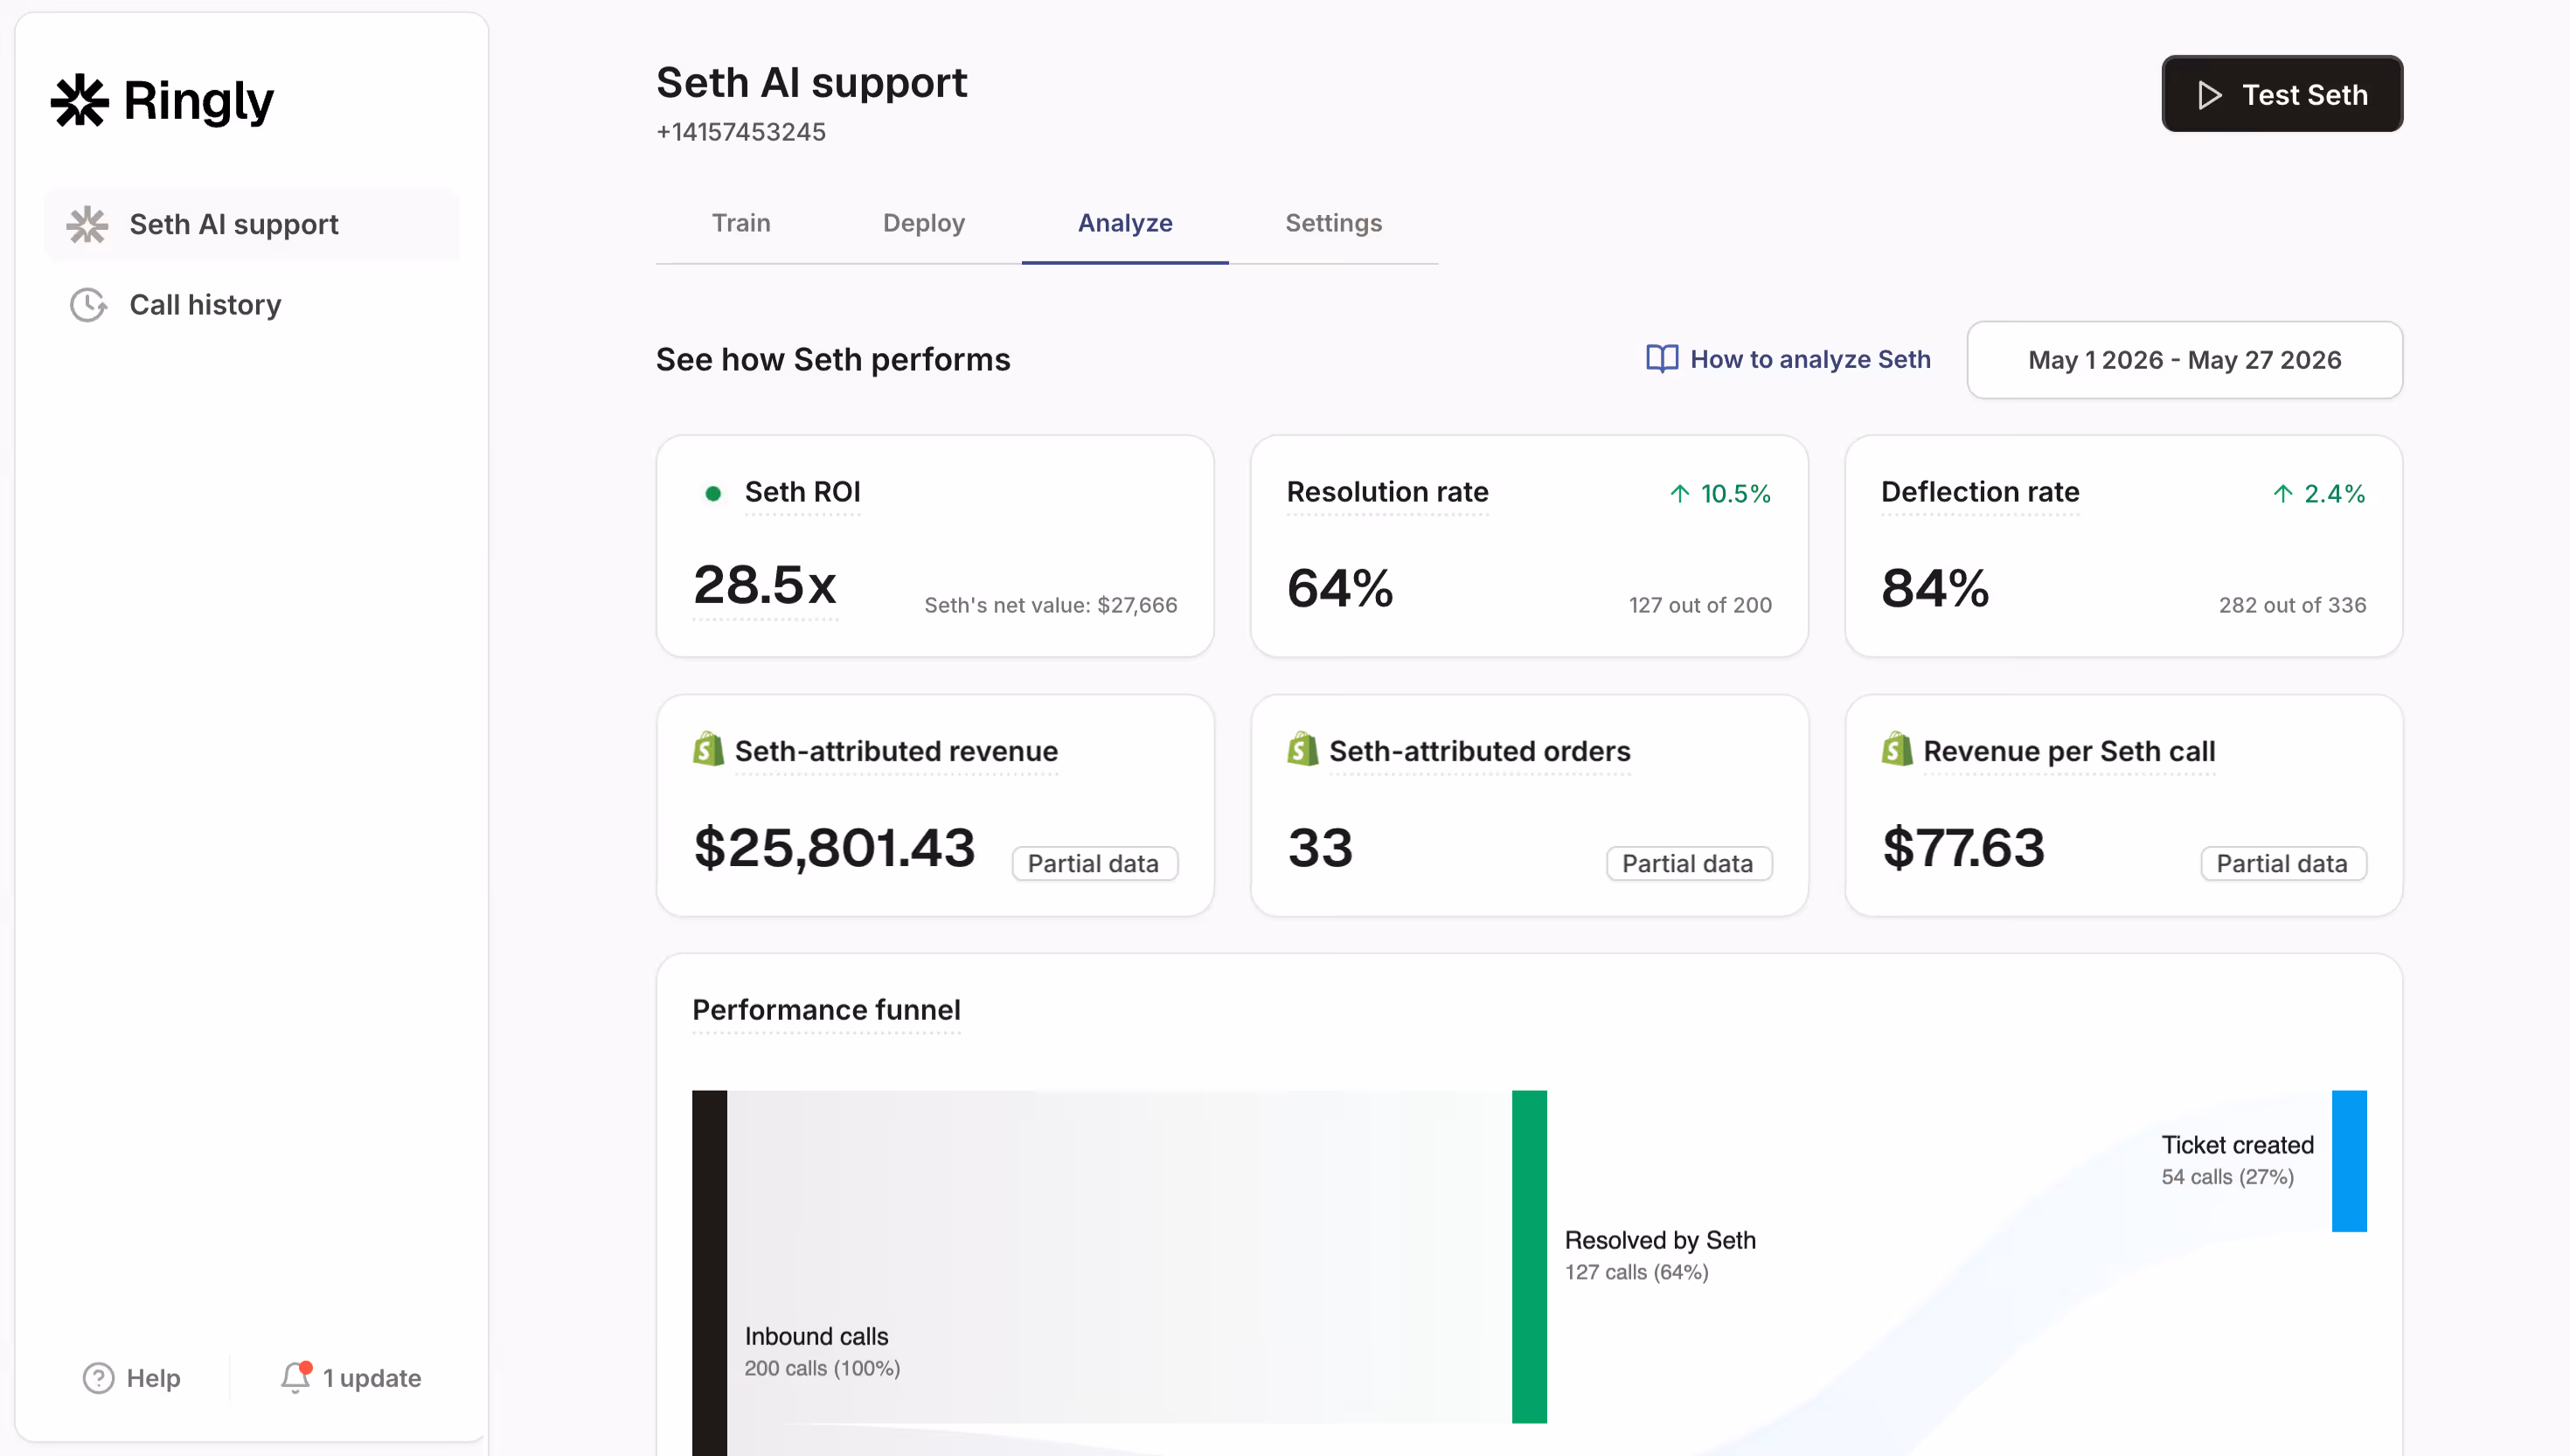
This is the gap Ringly.io was built to close. Ringly is AI phone support for Shopify brands. It answers your inbound calls 24/7, finds orders, handles returns and product questions, escalates cleanly to Gorgias when a human is needed, and reports the calls Gorgias can't: volume, resolution, and the revenue each call recovered. Across 50+ brands the AI resolves 73% of calls autonomously at roughly $0.42 per resolved call. WashCo, a Shopify brand we launched, recovered $22,664 in its first 7 days on the phone, none of which a Gorgias-only report would have surfaced.
The reporting gap usually maps to a payroll problem too. Take a typical $50M Shopify brand running a 6-rep CS team:
| Line item | Today | With Ringly |
|---|---|---|
| 6 reps × $4K loaded per rep | $24,000/mo | n/a |
| Ringly (illustrative) | n/a | $5,000/mo |
| Net monthly CS spend | $24,000/mo | $5,000/mo |
| Monthly savings | n/a | $19,000/mo |
| Annual savings | n/a | $228,000/yr |
That's roughly 70% of repeatable calls (order status, returns, the same five questions over and over) handled by the AI, with the genuinely hard calls still going to your team. If you want to see what your own phone line is leaving out of your reports, book a 30-min call and we'll do the math live. It pairs naturally with the rest of your ecommerce customer service stack, and you keep Gorgias as your helpdesk.
One more note for anyone weighing whether to add the Voice add-on for better phone numbers: read the reporting limits first, because the add-on still doesn't give you abandonment rate. If you're shopping the broader category, our Gorgias alternatives breakdown covers where each tool's reporting actually holds up. For the phone side specifically, 24/7 ecommerce phone support and call analysis are the two to read next, and if your call spikes hit during launches, Shopify Plus customer service covers handling the surge.
Frequently asked questions
Where do I find reports in Gorgias? From your helpdesk, click the dropdown in the top-left corner and select Analytics. Everything (live statistics, support performance, satisfaction, the AI Agent report, and your custom dashboards) lives there.
What metrics does Gorgias track? The core set is first response time, resolution time, closed tickets, one-touch ticket rate, CSAT (Satisfaction Score), and ticket volume. Beyond those, custom dashboards give you 70-plus metrics you can filter by channel, agent, tag, ticket field, and integration.
Is Gorgias resolution time an average or a median? A median. Gorgias uses the median for both first response time and resolution time so a few extreme tickets don't distort the number. If the median looks healthy but the floor feels busy, open the drill-down and check the slow tail the median is hiding.
Can I export Gorgias reports? Yes. Any dashboard chart exports to CSV via Actions, then Download Data. For ticket-level detail, owners, admins, and leads can export tickets from a view or an analytics drill-down, and Gorgias emails a download link that stays active for 14 days.
How many dashboards can I build in Gorgias? Up to 10 dashboards, with up to 20 charts each, drawn from a library of 70-plus metrics. Most support leads only need four well-built dashboards, so don't feel obligated to fill all ten.
Does Gorgias reporting cover phone calls? Only partially, and only for calls that run through the Gorgias Voice add-on. There's no call abandonment-rate metric, voice data only goes back to November 2023, and phone orders that never became a ticket don't appear in the Revenue report. A phone line on a separate system or an external AI phone agent won't show up in Gorgias reporting at all.
Talk to us

Gorgias reporting tells you a lot about email and chat. If your phone line lives outside Gorgias, your reports are missing the channel where your angriest, highest-intent customers show up. If you run a $10M-$100M Shopify brand and you're not sure what your phone is costing you, a 30-min call is the fastest way to see it.
The 3-layer guarantee.
- Live in 14 days or it's free until launched.
- 65% resolution in 90 days or we refund the last 3 months of subscription fees.
- We keep working free until we hit 65%.
Ruben (Ringly co-founder) takes these calls personally.