

This post in 30 seconds.
- The 7 returns KPIs worth a spot on your dashboard, each with the formula and a 2026 benchmark so you know what "good" looks like.
- Return rate alone is a vanity number. Net return rate and return-to-exchange ratio are the ones that map to your P&L.
- The KPI almost nobody tracks: return-driven contact rate. We counted how often "where's my refund" was the real reason inside 150,000 real support calls. Built for $10M-$100M Shopify brands running a paid helpdesk and a phone line.
Returns crossed roughly 20% of online orders this year, and the National Retail Federation puts the 2025 total near $849.9 billion. For a $10M-$100M Shopify brand, that number doesn't land as a logistics line on a spreadsheet. It lands as a phone backlog. "Where's my refund" calls, post-holiday return spikes, the same questions over and over from customers who shipped something back two weeks ago and haven't heard a word.
Most returns KPI guides treat returns as a warehouse problem. They are. But if you run customer experience at a Shopify brand and you've watched your CS team drown in refund-status calls every January, you already know returns are also a support problem. This post covers both sides. Seven KPIs, the formula for each, the benchmark, and the one metric that sits between your returns app and your phone line that almost nobody puts on a dashboard.
If you're early on building a returns scorecard and want to talk through which numbers actually move your margin, book a 30-min call and we'll walk your case. We've launched AI phone agents for 50+ Shopify brands fighting exactly this.
The 7 returns KPIs at a glance
Here's the full set, with how to calculate each and a 2026 benchmark to measure against. The deep dives follow.
| KPI | How to calculate | 2026 benchmark |
|---|---|---|
| Return rate | Returned orders ÷ total orders × 100 | ~15-20% online overall |
| Net return rate | (Refunds − value kept via exchange/credit) ÷ revenue × 100 | Track the gap vs gross |
| Return-to-exchange ratio | (Exchanges + store credit) ÷ total returns × 100 | Higher is better |
| Time-to-refund | Days from item received to refund issued | 7 days or less |
| Cost per return | (Reverse shipping + labor + restocking + CS handling) ÷ returns | Track the trend, not a fixed target |
| Return reason mix | Each reason ÷ total returns × 100 | Wrong-size and not-as-described should shrink |
| Return-driven contact rate | Return/refund-status contacts ÷ total CS contacts × 100 | Lower is better |
A returns dashboard with all seven tells you three things at once: how much product comes back, how much revenue you keep, and how much support load returns are quietly creating. Most brands track the first and miss the other two.
Where these benchmarks come from
I'm Ruben, co-founder of Ringly. We run AI phone support for 50+ Shopify brands, which means I look at return-and-refund calls constantly, not as a logistics person, as the one who answers the phone.
The external benchmarks below are sourced (NRF, Salesforce, ZigZag, and category data from the returns-software vendors). Where I cite a benchmark, the link is on the number.
The one number you won't find anywhere else came from our own data. We read the return-and-refund calls inside 150,000 real support calls and counted how often "where's my refund" was the actual reason someone picked up the phone. That's the seventh KPI in this post, and it's the one your returns dashboard never shows you, because it doesn't live in your returns app. It lives in your call log.
1. Return rate
The headline metric. The share of orders that come back.
Formula: returned orders ÷ total orders × 100.
The overall online benchmark sits around 15-20% per the NRF 2025 Retail Returns Landscape, with online specifically running near 19.3%. But the average is close to useless on its own, because return rate is wildly category-dependent.
| Category | Typical return rate |
|---|---|
| Apparel / clothing | 20-40% |
| Footwear | 17-30% |
| Electronics | 8-15% |
| Beauty / cosmetics | 4-12% |
Source: 2025 category benchmarks compiled by Richpanel. If you sell apparel and your return rate is 22%, you're doing fine. If you sell supplements and it's 22%, something is broken.
One caveat that keeps return rate honest: it's a vanity number if you stop there. A 25% return rate where most customers swap for another size is a very different business than a 25% rate where everyone takes cash back. That's why the next two KPIs exist. And watch it climb during the seasonal spike. January return volume can run double a normal month, which is exactly when your returns process and your phone line get tested at the same time.
2. Net return rate (revenue retained)
Gross return rate counts every unit that comes back. Net return rate counts the revenue you actually lose after exchanges, store credit, and the units that get resold.
Formula: (refunds issued − value kept via exchange or store credit) ÷ revenue × 100.
This is the number to put in front of finance, because it maps to the P&L. A brand with a 30% gross return rate that converts half of those into exchanges has a net rate closer to 15%. Same returns, very different margin story.
Net return rate also has to account for what doesn't come back as legitimate. Roughly 9% of all returns are fraudulent per the NRF, and 85% of retailers now use some form of AI to flag return abuse. Wardrobing, bracketing, the empty-box trick. If you're not netting that out, your "revenue retained" number is rosier than reality.
3. Return-to-exchange ratio
Of all the returns you process, what share become an exchange or store credit instead of a cash refund? That's revenue you keep inside the business.
Formula: (exchanges + store credit) ÷ total returns × 100.
83% of ecommerce stores now offer exchanges, and a common play is offering 10-15% bonus store credit to nudge a customer toward an exchange over a refund. A higher ratio here is one of the cleanest levers on returns margin, because the customer keeps shopping and you keep the revenue. If your exchange flow is clunky or buried, this ratio is where it shows up.
4. Time-to-refund
How many days pass between the item landing in your warehouse and the customer's money or credit being issued.
Formula: days from item received to refund or credit issued (track the average and the 90th percentile).
This is the KPI that drives both CSAT and your phone volume. The average refund period stretches to about 9.5 days, but 85% of shoppers are only willing to wait up to a week. The fastest brands clear it in 3-5 days. Every day past the customer's mental deadline is a day they pick up the phone to ask where their money is.
That gap, the difference between when you refund and when they expect it, is the single biggest generator of "where's my refund" calls. Shrink time-to-refund and the refund-status calls shrink with it. If your CS team is fielding the same refund-timing question 40 times a day during the post-holiday window, book a 30-min call and we'll show you what that volume looks like when an AI handles the status checks.
5. Cost per return
The total cost to process one returned unit, all the way from the customer hitting "start a return" to the item being back in inventory or written off.
Formula: (reverse shipping + warehouse labor + restocking + CS handling) ÷ number of returns.
Most brands count the shipping and the warehouse labor and stop. The line item they leave out is CS handling: the rep time spent answering "did you get my return," "when's my refund," and "can I get an exchange instead." On a small team that's invisible until you add it up, and then it's a real slice of payroll.
Here's the math on that slice. Take a typical $50M Shopify brand running a 6-rep CS team:
| Line item | Today | With Ringly |
|---|---|---|
| 6 reps × $4K loaded per rep | $24,000/mo | n/a |
| Ringly Enterprise (~$5K/mo) | n/a | $5,000/mo |
| Net monthly CS spend | $24,000/mo | $5,000/mo |
| Monthly savings | n/a | $19,000/mo |
| Annual savings | n/a | $228,000/yr |
A big chunk of that repeatable load is return-and-refund status chasing, the kind of call that follows a script and never needs a human. WashCo, a Shopify brand we launched, recovered $22,664 in its first 7 days on the phone by catching calls that used to roll to voicemail. Book a 30-min call and we'll do the cost-per-return math on your actual call volume. You can also run the rough numbers yourself with our WISMO handling cost calculator.
6. Return reason mix
The distribution of why things come back. Wrong size, damaged, not as described, changed mind, ordered multiples on purpose.
Formula: each reason's count ÷ total returns × 100.
This is the only KPI on the list that tells you how to reduce returns at the source rather than just process them faster. If 40% of your apparel returns are "wrong size," that's a sizing-chart and product-page problem, not a returns problem. If "not as described" is climbing, your photography or copy is overselling. Tag every return with a reason and the mix tells you where to spend your next fix. We've written more on reducing product returns if that's where your numbers point.
7. Return-driven contact rate (the KPI most teams miss)
Here's the one that almost never makes it onto a returns dashboard, because it doesn't live in your returns app. It lives in your helpdesk and your call log.
Formula: return-and-refund-status contacts ÷ total CS contacts × 100.
Returns generate their own wave of customer contacts, separate from the original "where's my order" wave. WISMO contacts already run 40-60% of inbound support volume for brands without proactive notifications. The return-side version, sometimes called WISMR ("where is my refund"), is the second wave: customers who shipped something back and now want to know where their money is.
Return-driven contact rate is the bridge metric between your returns operation and your phone line, and it's the slice of support volume you can automate almost entirely. Most of these contacts are status checks against a Shopify order and a returns record. There's no judgment call, no escalation, just a lookup and a clear answer. That's exactly the work an AI phone agent handles without a human ever touching it.
This is the number we counted inside those 150,000 calls. Refund-status was one of the most common reasons someone called at all, and almost every one of those calls could be answered the second the customer asked, instead of sitting in a voicemail queue until Monday.
"My customers also feel like it's a normal person. They feel like they can communicate if they have questions."
Claudia Droge, TechCraft Studio
It matters because returns are a retention moment, not just a cost. 73% of consumers say they won't buy again after a poor returns experience. A refund-status call that hits voicemail at 9 p.m. and never gets returned is a churned customer you'll never see in the dashboard.
How to build a returns KPI dashboard
You don't need all seven on one screen. Put the right three in front of the right people.
- Exec view (3 KPIs): net return rate, time-to-refund, and return-driven contact rate. These map to margin, customer satisfaction, and support load. Everything else is operational detail underneath them.
- Ops view (the full seven): the team running returns watches reason mix and cost per return weekly to find the next fix.
- Where each number lives: return rate, net rate, and time-to-refund come from Shopify plus your returns app. Reason mix and exchange ratio come from the returns app. Return-driven contact rate comes from tagging your helpdesk tickets and your call log.
- Cadence: monthly for the exec view, weekly for ops, and daily during the post-holiday return spike when every number moves at once.
Pair the returns KPIs with your broader customer service KPIs and you get the full picture: how much comes back, how much you keep, and how much it's costing your team to handle the fallout on the phone.
Frequently asked questions
What is a good return rate for ecommerce?
There's no single good number, because it's category-dependent. Overall online return rates run around 15-20%, but apparel can hit 30-40% while electronics often stay under 15%. Compare yourself to your category, not the global average.
What's the difference between return rate and refund rate?
Return rate counts every order that comes back. Refund rate counts only the returns that result in cash back to the customer. The gap between them is your exchanges and store credit, which is revenue you kept.
What is return-to-exchange ratio and why does it matter?
It's the share of returns that become an exchange or store credit instead of a cash refund. A higher ratio means more revenue stays in the business. 83% of stores now offer exchanges, and many add 10-15% bonus credit to nudge customers toward keeping their money on-site.
How fast should a refund be processed?
Customers expect a refund within about a week, but the industry average stretches to roughly 9.5 days. The fastest brands clear refunds in 3-5 days from receiving the item. Every day past the customer's expectation generates a "where's my refund" contact.
What is cost per return?
It's the total cost to process one returned unit: reverse shipping, warehouse labor, restocking, and the often-forgotten CS handling time. Adding the support cost is what separates a real cost-per-return number from a warehouse-only estimate.
What is return-driven contact rate?
It's the percentage of your customer support contacts that are about a return or refund status. It bridges your returns operation and your phone line, and it's one of the most automatable slices of support volume because most of these contacts are simple status lookups.
How does Ringly help with return and refund calls?
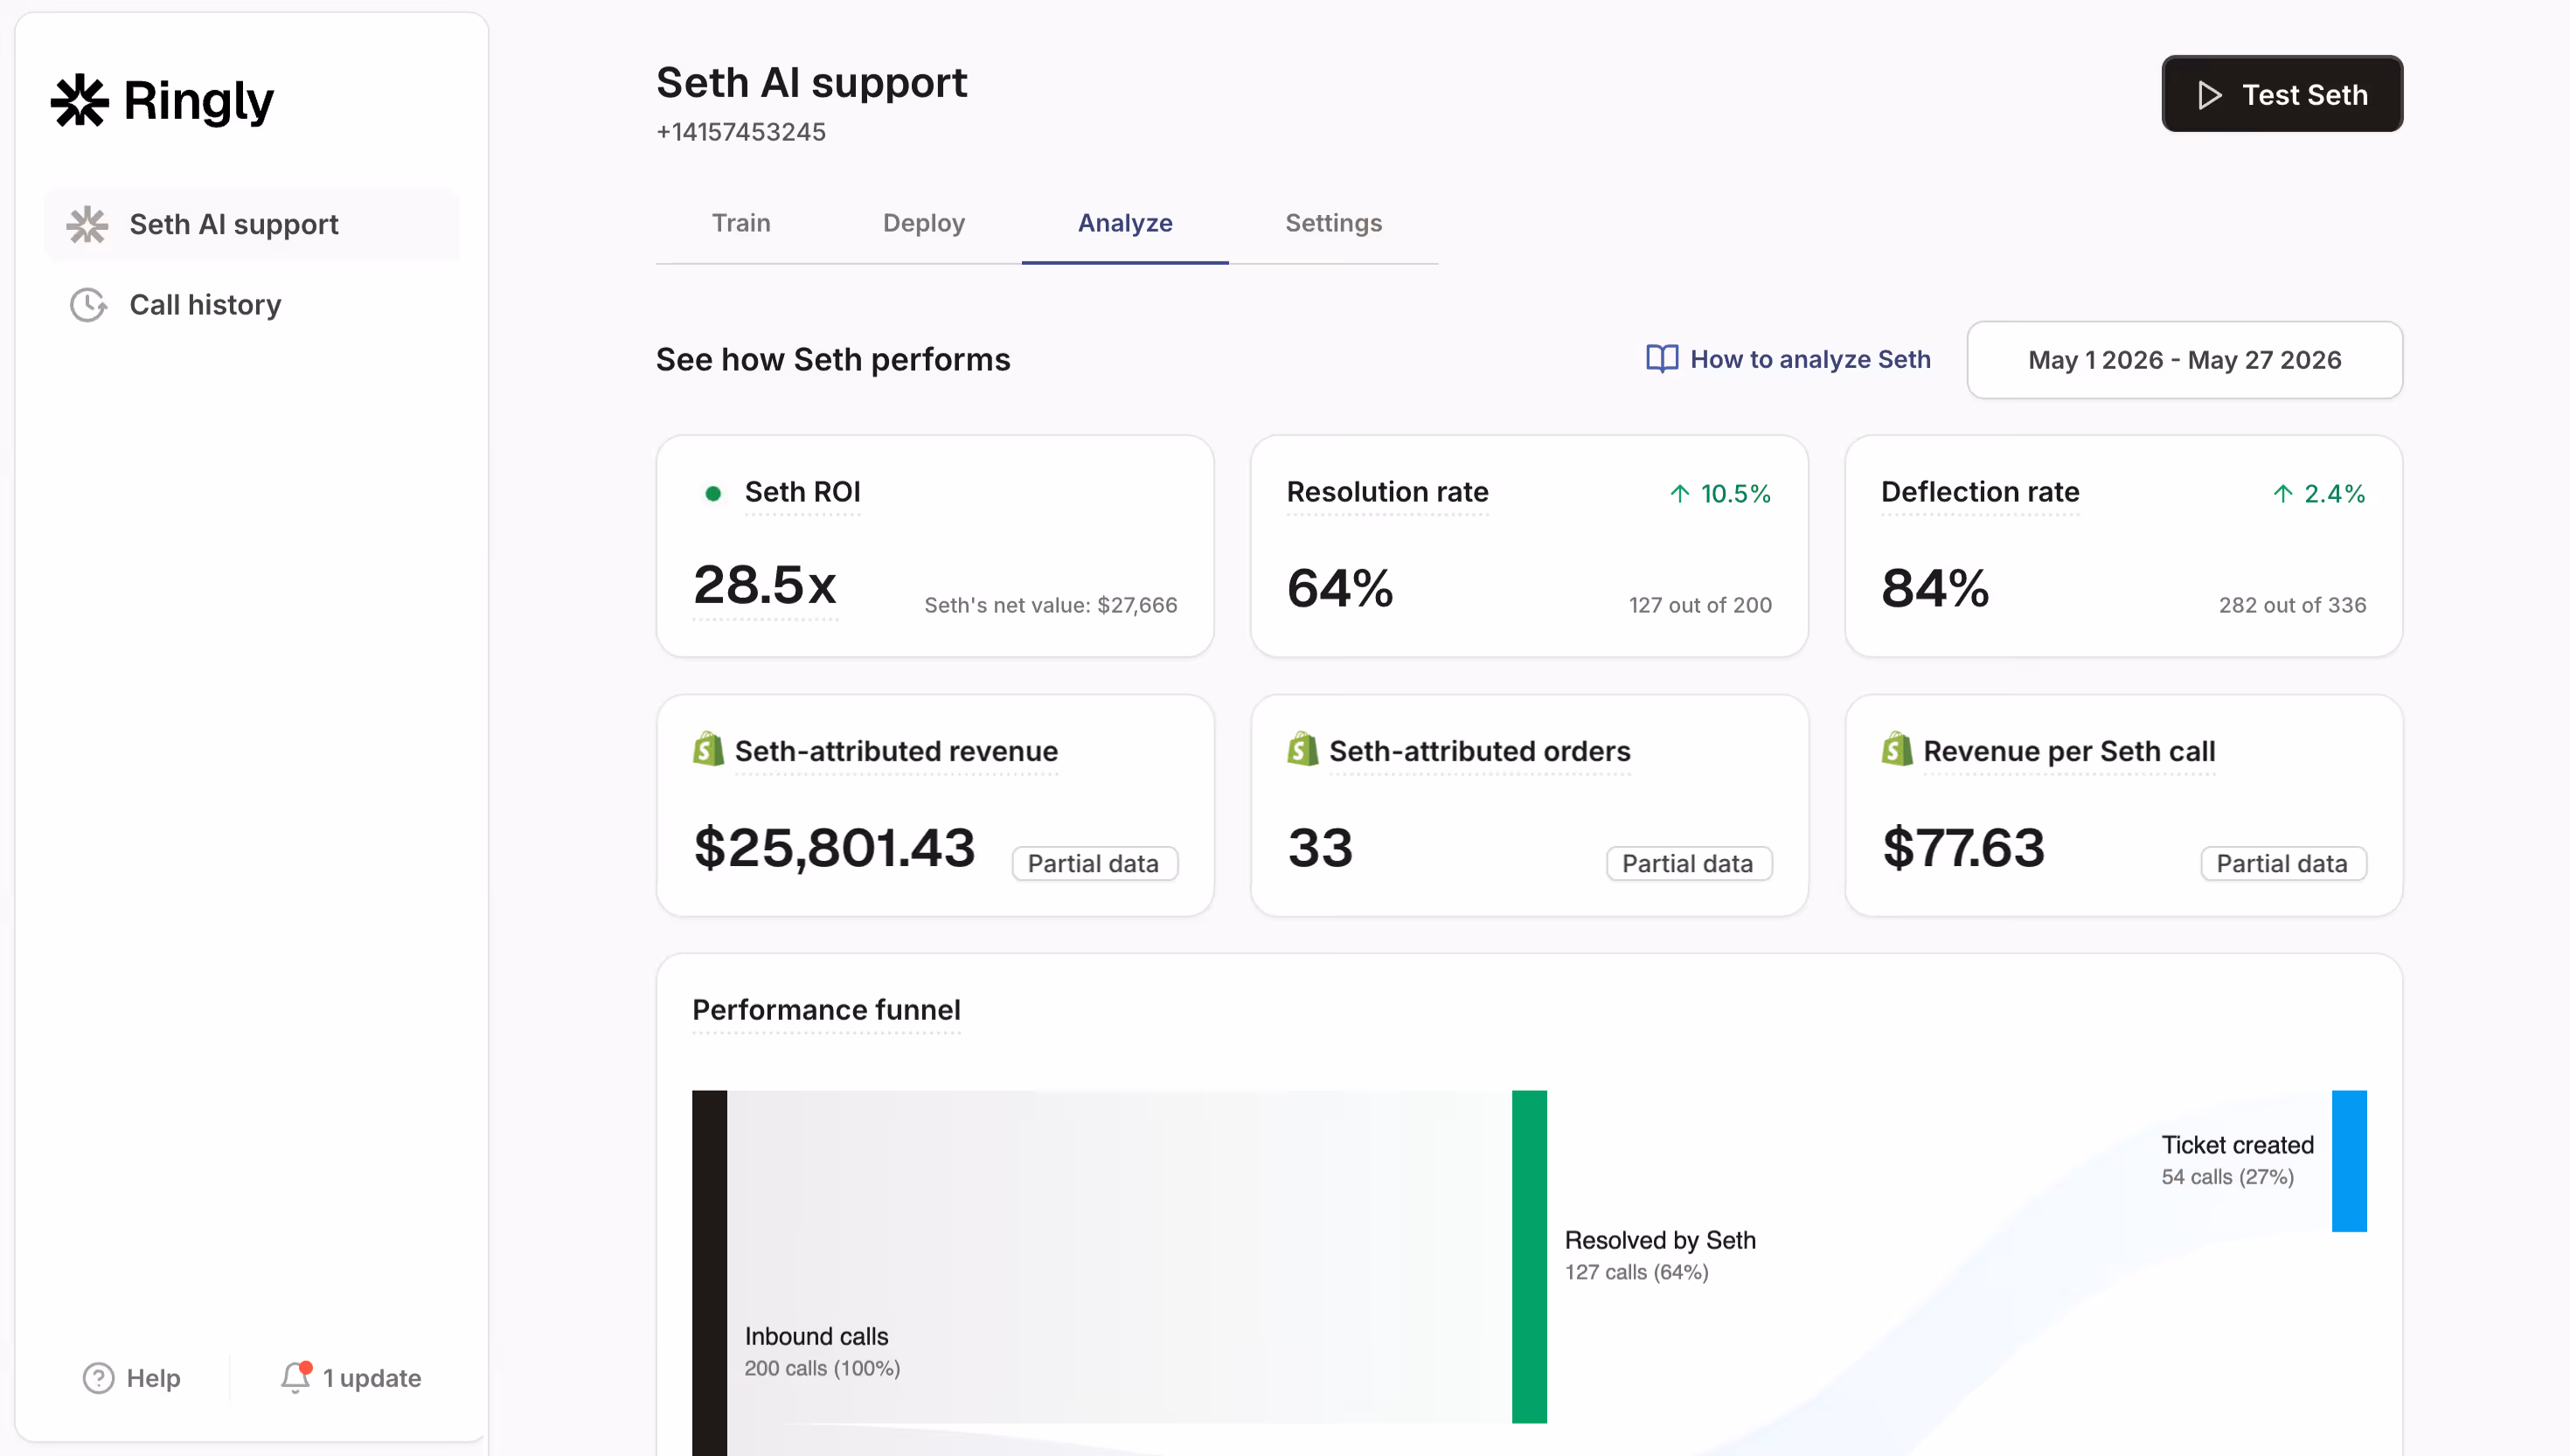
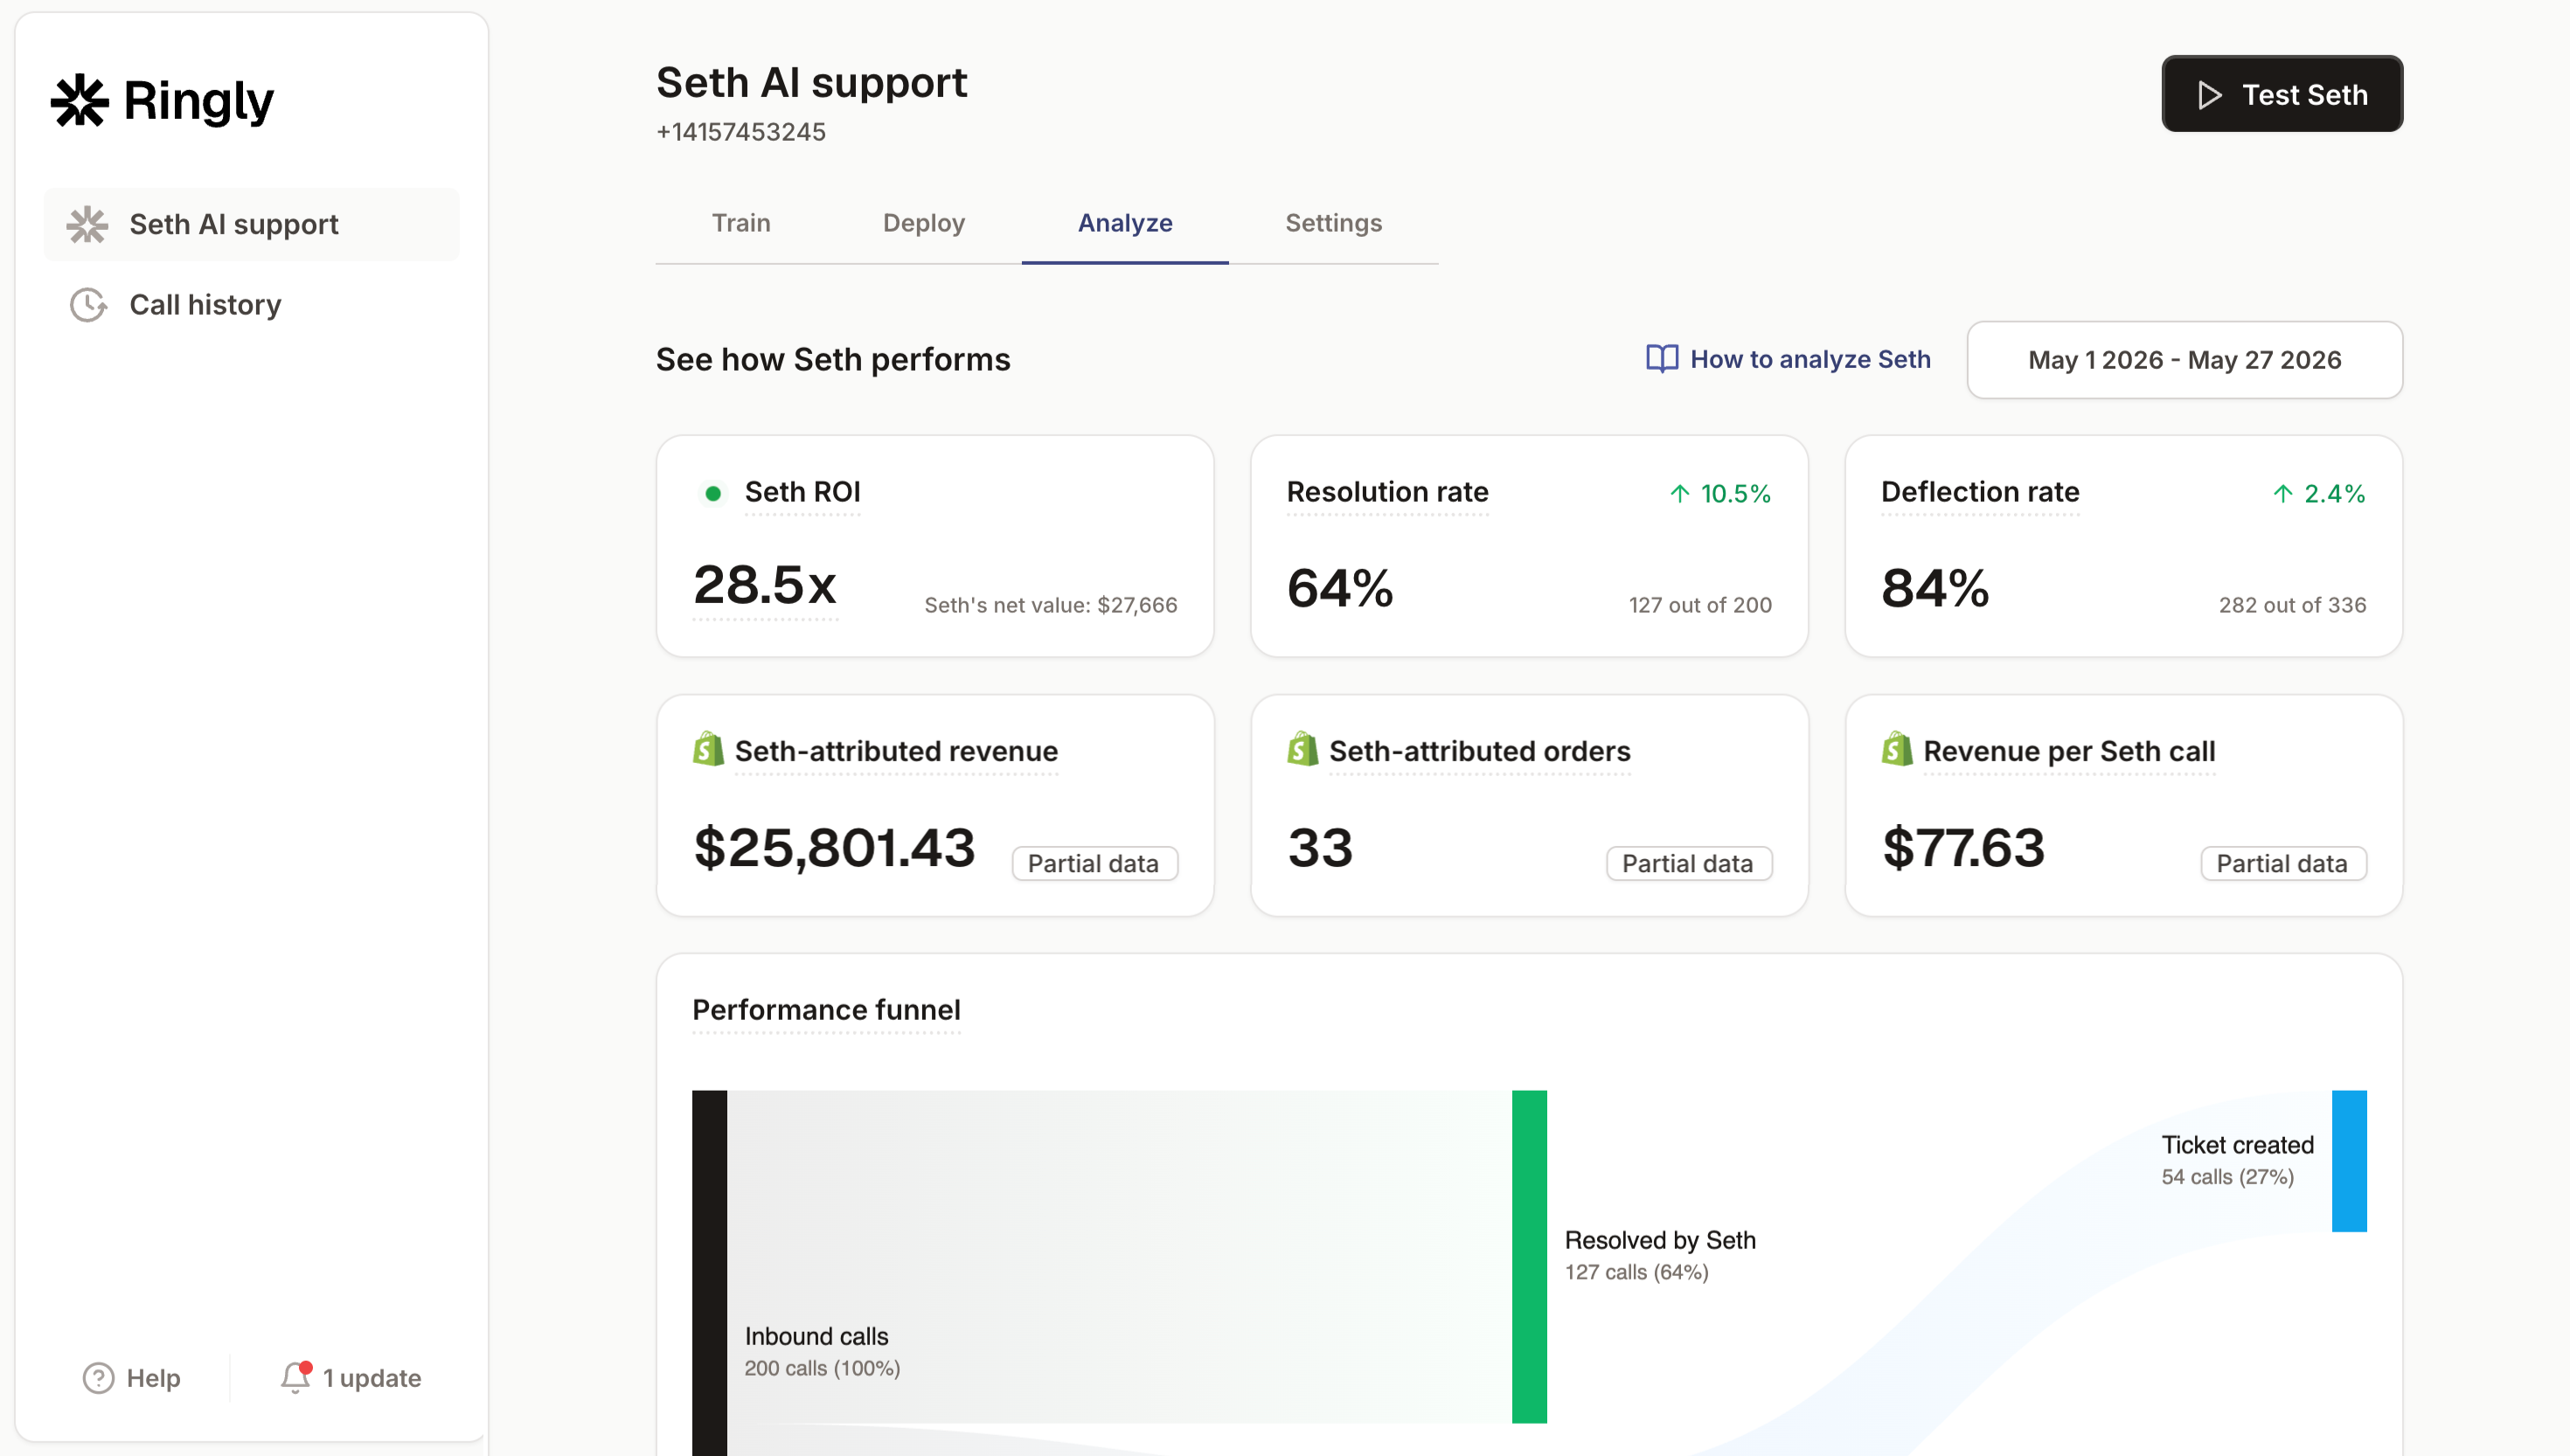
Ringly is AI phone support for Shopify brands. The AI answers inbound calls 24/7, finds the order in your Shopify store, checks return and refund status, and answers the question on the spot, escalating to your helpdesk only when a human is genuinely needed. Across 50+ brands it resolves 73% of calls autonomously at roughly $0.42 per resolved call.
Talk to us

If you run a $10M-$100M Shopify brand and your return-and-refund calls are eating rep time you can't get back, a 30-min call is the fastest way to see what that volume actually costs and how much of it an AI can take off your team.
The 3-layer guarantee.
- Live in 14 days or it's free until launched.
- 65% resolution in 90 days or we refund the last 3 months of subscription fees.
- We keep working free until we hit 65%.
Ruben (Ringly co-founder) takes these calls personally.