
Retailers lost $1.77 trillion in 2023 to stockouts and overstocks. That is not a typo. Trillion.
With a T. Behind every one of those dollars was a forecasting mistake.
Someone ordered too much. Or too little. Or the right amount at the wrong time.
Ecommerce demand forecasting is how you avoid becoming part of that statistic.
It is the process of predicting what your customers will buy, when they will buy it, and how much they will want.
Done right, it keeps your shelves stocked, your cash flowing, and your customers happy.
Done wrong, it drains your bank account and sends shoppers to your competitors.
This guide breaks down exactly how ecommerce demand forecasting works, which methods to use, and how to implement it in your store without needing a PhD in data science.
Editor’s note: Want to hear some sample AI support calls made for your Shopify store?
- Just paste your store URL
- Get sample calls in under 20 seconds (no email required)
- Listen to demo calls for my store
What is ecommerce demand forecasting?
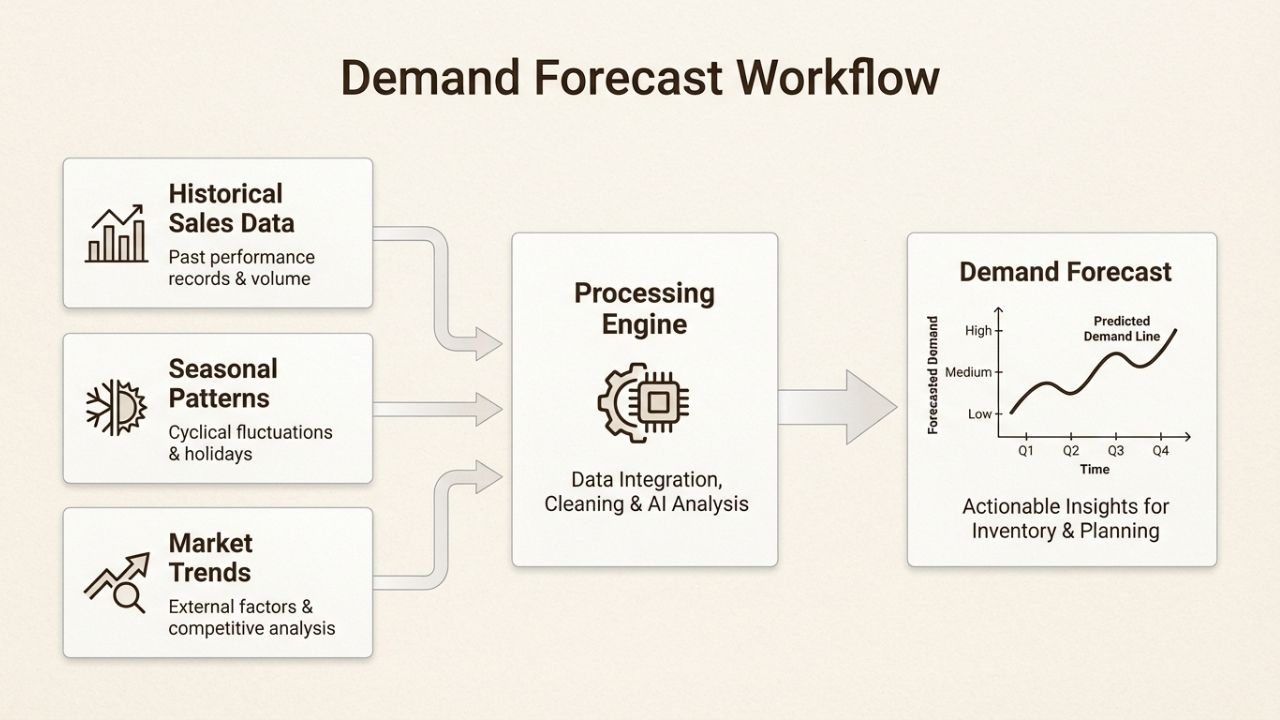
At its core, ecommerce demand forecasting is educated guesswork backed by data.
You analyze historical sales, customer behavior, and market trends to predict future demand. The goal is simple: have the right products in the right quantities at the right time.
Here is what makes ecommerce forecasting different from traditional retail. Online stores move faster.
Customer behavior shifts in hours, not weeks. A TikTok video can spike demand overnight. Shipping happens globally, not regionally. Your competition is a click away, not across town.
The inputs for a solid forecast include:
- Historical sales data: What sold, when, and how much
- Customer metrics: Number of customers, repeat purchase rates, average order value
- Seasonal patterns: Holiday rushes, summer slowdowns, back-to-school spikes
- Marketing calendar: Planned promotions, product launches, sales events
- External factors: Economic conditions, competitor moves, supply chain disruptions
Getting this right matters. When you overstock, you tie up cash in inventory that might go stale.
When you understock, you lose sales and frustrate customers who may never return. The sweet spot is forecasting accurately enough to keep just enough inventory on hand without drowning in it.
Why demand forecasting matters for your store
Let us talk about what accurate forecasting actually delivers. It is not just about having fewer spreadsheets to manage.
Optimize inventory levels. This is the obvious one. You want enough stock to meet demand without turning your warehouse into a museum of unsold goods. Good forecasting helps you find that balance.
Improve cash flow. Inventory is cash sitting on shelves. The less you tie up in excess stock, the more you have available for marketing, product development, or weathering slow months. One retailer using Inventory Planner reported freeing up $1.5 million in working capital after optimizing their forecasts.
Increase customer satisfaction. Nothing kills a sale faster than an "out of stock" message. When customers find what they want, when they want it, they buy. When they cannot, they bounce to Amazon or a competitor.
Refine pricing strategy. Forecasting reveals demand patterns. High demand plus low stock equals opportunity to raise prices. Slow-moving inventory signals time for a promotion or bundle deal.
Better marketing ROI. Align your ad spend with expected demand. Ramp up marketing when forecasts show strong interest. Pull back when inventory is tight. This prevents the nightmare of driving traffic to products you cannot fulfill.
Support growth decisions. Thinking about expanding into new markets? Launching a new product line? Your forecast history helps you model what might happen and plan accordingly.
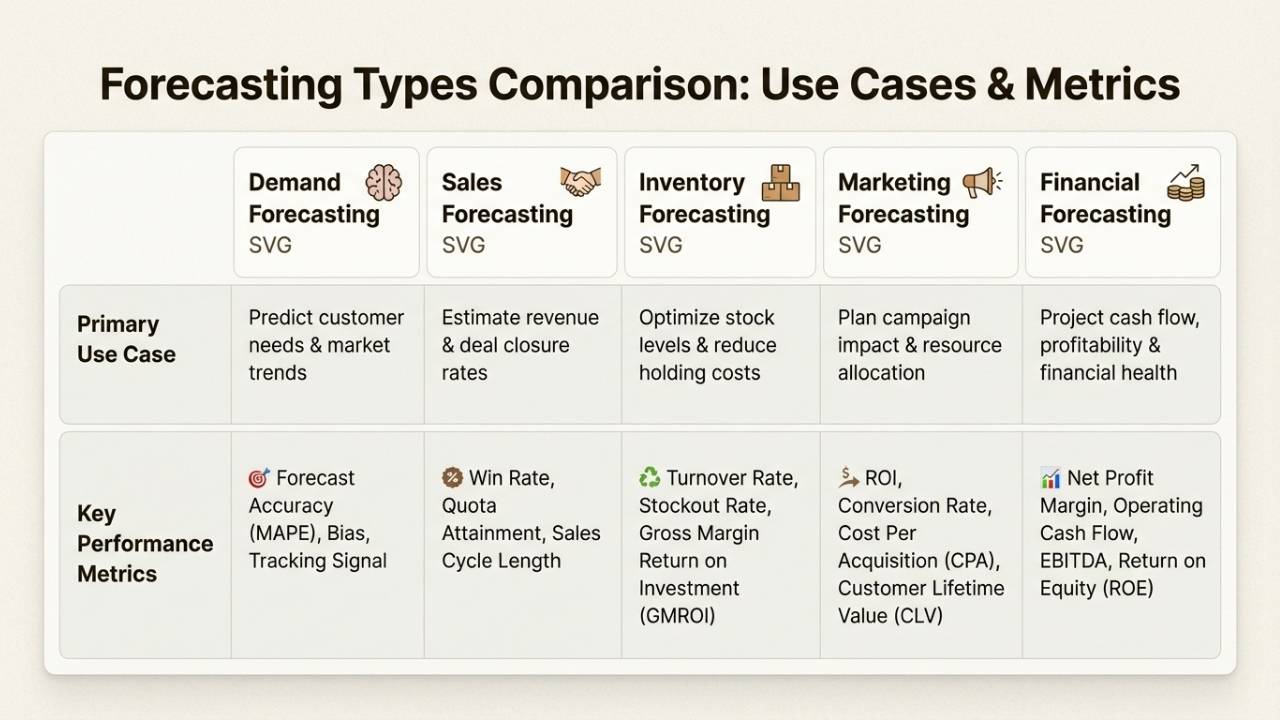
The five types of ecommerce forecasting
Not all forecasts serve the same purpose. Understanding the different types helps you pick the right tool for each job.
Demand forecasting
This predicts how much customers will want to buy. It is the foundation for everything else.
You use it to plan procurement, set safety stock levels, and decide how much raw material to order.
Demand forecasting looks at historical purchase volume, seasonality, and SKU-level velocity to answer one question: how much will customers want?
Sales forecasting
While demand forecasting asks what customers want, sales forecasting asks what they will actually buy given your inventory, pricing, and marketing.
It estimates revenue, units sold, and category performance.
Sales forecasts tend to be more conservative because they account for real-world constraints like stock availability and conversion rates.
Inventory forecasting
This focuses specifically on stock levels. How quickly will inventory move? When should you reorder? How much safety stock do you need?
Inventory forecasting must happen at the SKU level, not category averages.
A product that sells ten units daily needs different handling than one that sells ten units monthly.
Marketing forecasting
Marketing forecasting projects campaign performance, ROAS, and customer acquisition costs.
It helps you allocate budget efficiently across channels and time periods. Strong operators forecast marketing outcomes using historical CAC, cohort-based lifetime value, and channel-specific performance curves.
Financial forecasting
This ties everything together into a business model. It predicts revenue, gross margin, cash flow, and working capital needs.
Financial forecasting determines how aggressively you can buy inventory, scale marketing, or expand operations.
Forecasting methods: From simple to advanced
You do not need a data science team to start forecasting. Begin simple and add complexity as your business grows.
Qualitative methods
Use these when historical data is limited or you are entering uncharted territory.
Market research involves analyzing consumer behavior, preferences, and buying patterns. Surveys and focus groups fall into this category.
Expert opinion taps into the knowledge of category managers, industry veterans, or consultants who have seen similar situations before.
The Delphi method gathers structured input from multiple experts through rounds of anonymous questionnaires, building consensus over time.
These methods work best for new product launches, market expansions, or when quantitative data is thin.
Quantitative methods
Once you have sales history, statistical methods become your friend.
Time series analysis identifies patterns in historical data. It spots seasonality, trends, and cyclical fluctuations.
This works well for products with consistent demand patterns.
Moving averages smooth out short-term noise to reveal baseline demand. Simple but effective for stable products.
Exponential smoothing gives more weight to recent data. Helpful when trends shift but history still matters.
Regression analysis identifies relationships between demand and variables like price changes, ad spend, or economic indicators.
This helps you understand cause and effect, not just correlation.
Advanced and AI-powered methods
As data volume grows, machine learning becomes viable.
Machine learning models automatically learn from SKU performance, traffic spikes, pricing changes, and inventory cycles.
They outperform traditional models in categories where demand is volatile or influenced by many factors.
Predictive analytics maps behavioral signals like clicks, cart additions, and session data to forecast demand.
Ensemble models combine multiple forecasting techniques to reduce bias and improve accuracy.
When should you upgrade from spreadsheets to specialized software?
When manual forecasting takes more than a few hours weekly, when you manage hundreds of SKUs across multiple channels, or when accuracy directly impacts significant revenue.
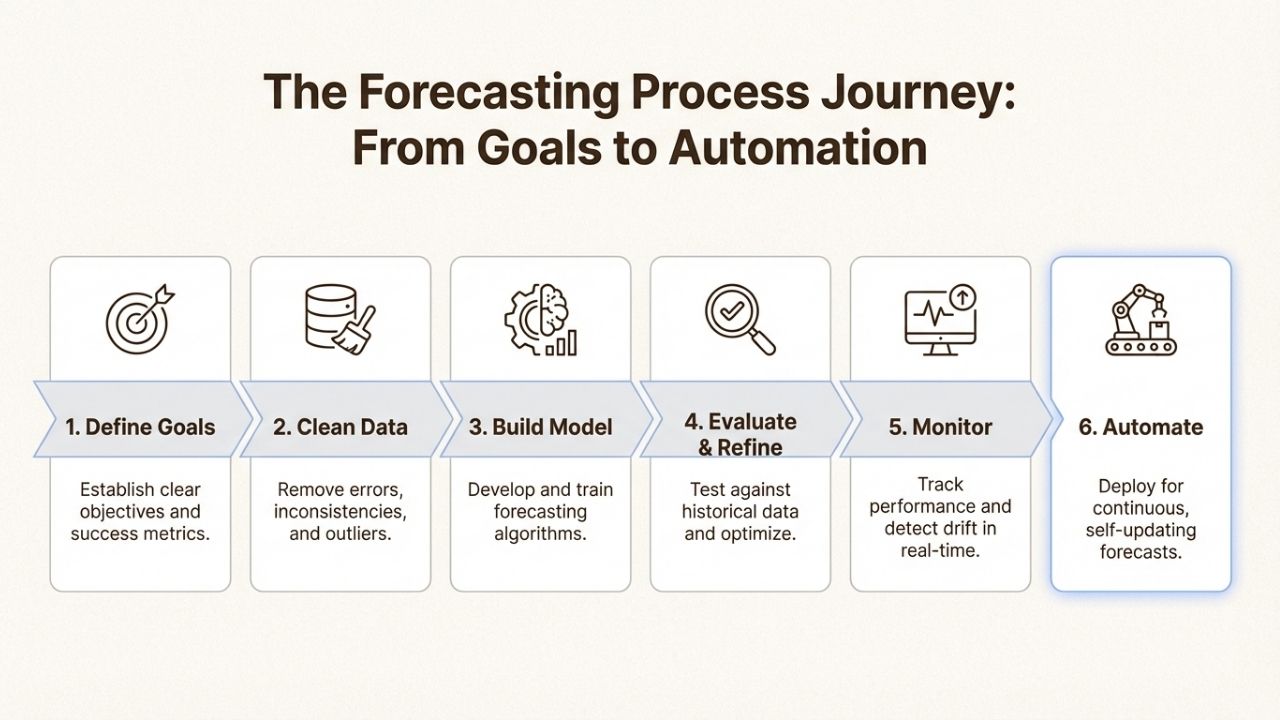
How to implement demand forecasting in 6 steps
Ready to start forecasting? Here is a practical roadmap.
Step 1: Define your goals. What are you forecasting for? Inventory planning? Cash flow management? Marketing budget allocation?
Your method and granularity depend on the answer. A forecast for investor presentations differs from one for weekly purchase orders.
Step 2: Collect and clean your data. Gather historical sales, returns data, inventory levels, marketing spend, and any external factors that influenced past performance. Clean means deduplicated, consistently formatted, and mapped correctly across platforms.
Bad data produces bad forecasts. No exceptions.
Step 3: Choose your method. Match your approach to your data maturity. Less than six months of history? Lean qualitative. One to two years? Time series and moving averages work well. Multiple years across many SKUs? Consider machine learning tools.
Step 4: Build your first forecast. Start simple. Pick a small product category or a single channel. Create a baseline forecast and compare it to actuals. Expect to be wrong. The goal is directional accuracy, not perfection.
Step 5: Monitor and adjust. Compare predictions to reality weekly. Track your forecast error rate. Adjust assumptions as you learn. Did a promotion drive unexpected demand? Note it. Did a competitor launch hurt sales? Factor it in next time.
Step 6: Scale and automate. As volume grows, move from spreadsheets to software.
Tools like Prediko or Inventory Planner integrate with Shopify and automate much of the heavy lifting.
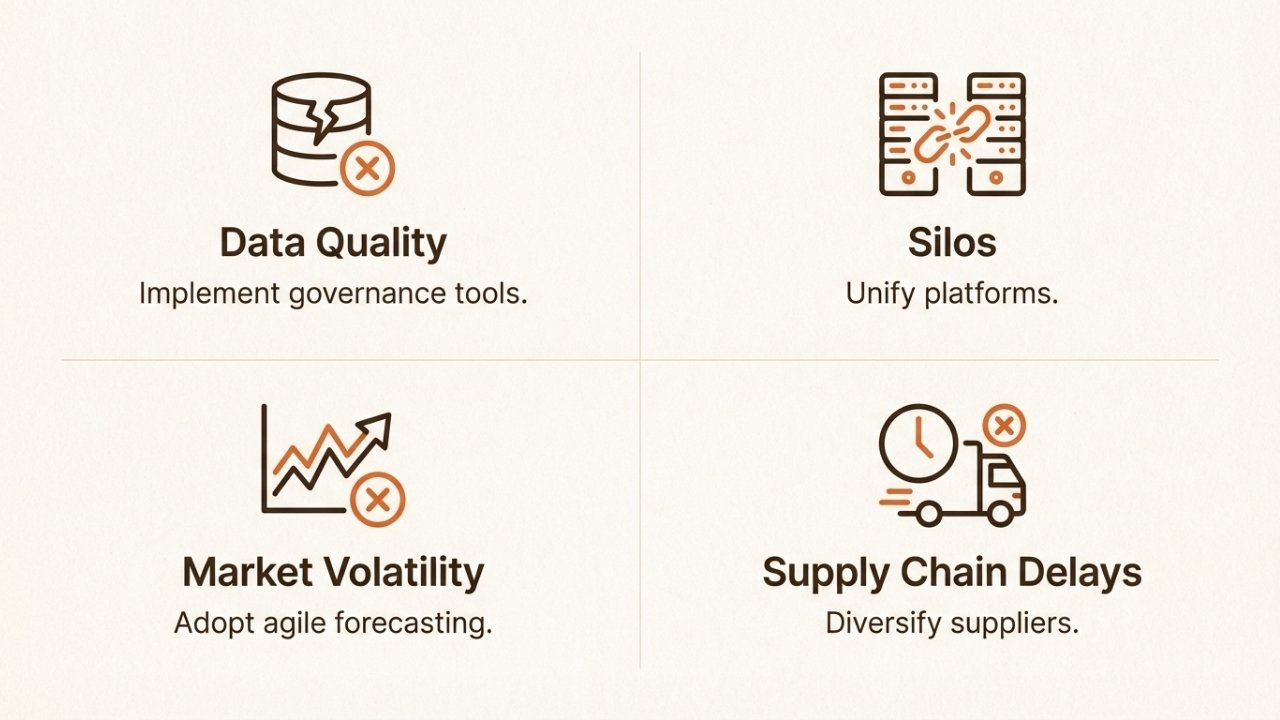
Common challenges and how to overcome them
Forecasting is not magic. It is messy, imperfect, and full of pitfalls. Here is what trips people up and how to handle it.
Data quality issues
Incomplete or inaccurate data corrupts everything. A single SKU mapped incorrectly across platforms can throw off your entire forecast. The fix? Implement data validation rules, deduplicate regularly, and maintain consistent SKU naming conventions across all systems.
Data silos across platforms
Your Shopify store knows sales. Your Amazon account knows marketplace performance. Your Meta Ads dashboard knows traffic sources.
Your ERP knows inventory. If these do not talk to each other, your forecast is built on partial information. Solutions range from manual spreadsheet consolidation to unified data platforms like Saras Analytics.
Volatile customer behavior
A viral TikTok video can sell out inventory in hours. A competitor's sale can crater your demand. Traditional models struggle with this volatility.
The answer is combining historical patterns with real-time signals and updating forecasts frequently. Daily updates beat monthly ones in fast-moving categories.
Supply chain delays
Even perfect demand forecasts fail if suppliers cannot deliver. Lead times have stretched in recent years, with some sectors seeing six-month waits.
Build safety stock buffers for critical SKUs. Maintain open communication with suppliers about production schedules. And always have a Plan B.
Top demand forecasting tools for ecommerce
Spreadsheets work until they do not. When you are ready for software, here are five solid options.
| Tool | Starting Price | Best For | Key Feature |
|---|---|---|---|
| Prediko | $119/month | Shopify stores | 93-97% forecast accuracy, one-click integration |
| Inventory Planner | $299/month | Multi-channel sellers | ABC classification, TikTok Shop integration |
| Cogsy | $299/month | Growing brands | Smart replenishment, cash flow planning tools |
| Fabrikator | $99/month | Small to mid-size stores | SKU-level predictions, affordable entry point |
| Cin7 | $399/month | Multi-location businesses | Advanced AI, 99% product availability target |
When evaluating tools, prioritize integration with your existing platforms.
A forecasting tool that cannot pull data from your Shopify store or Amazon account creates more work than it saves.
Start with free trials when available. Most offer 14 days to test before committing.
Best practices for accurate forecasting
Here is what separates good forecasts from bad ones.
Forecast at SKU level, not category averages. A category might show steady demand while individual SKUs swing wildly. Aggregate data hides the truth you need.
Update frequently. Weekly minimum for most businesses. Daily for volatile categories or during peak seasons. A forecast from last month is already stale.
Combine historical data with real-time signals. Past patterns matter, but so does what is happening right now. Sudden spikes in website traffic or cart additions often predict demand shifts before they show up in sales data.
Track and measure accuracy. Calculate your forecast error rate. If you are consistently off by 30%, your model needs adjustment. Aim for improvement, not perfection.
Share forecasts across teams. Marketing should know what inventory expects. Operations should know what marketing plans to promote. Finance should see both. Siloed forecasts create misaligned decisions.
Account for seasonality. Black Friday, summer slowdowns, back-to-school rushes. These patterns repeat. Build them into your models instead of treating them as surprises.
Build in buffers. Safety stock protects against supply chain hiccups. Just-in-time inventory is great until it is not. Maintain enough buffer to handle the unexpected.
When to consider AI phone support for your store
Accurate demand forecasting helps you stock the right products. But what happens when customers start calling about those products?
That is where automation becomes your next competitive advantage.
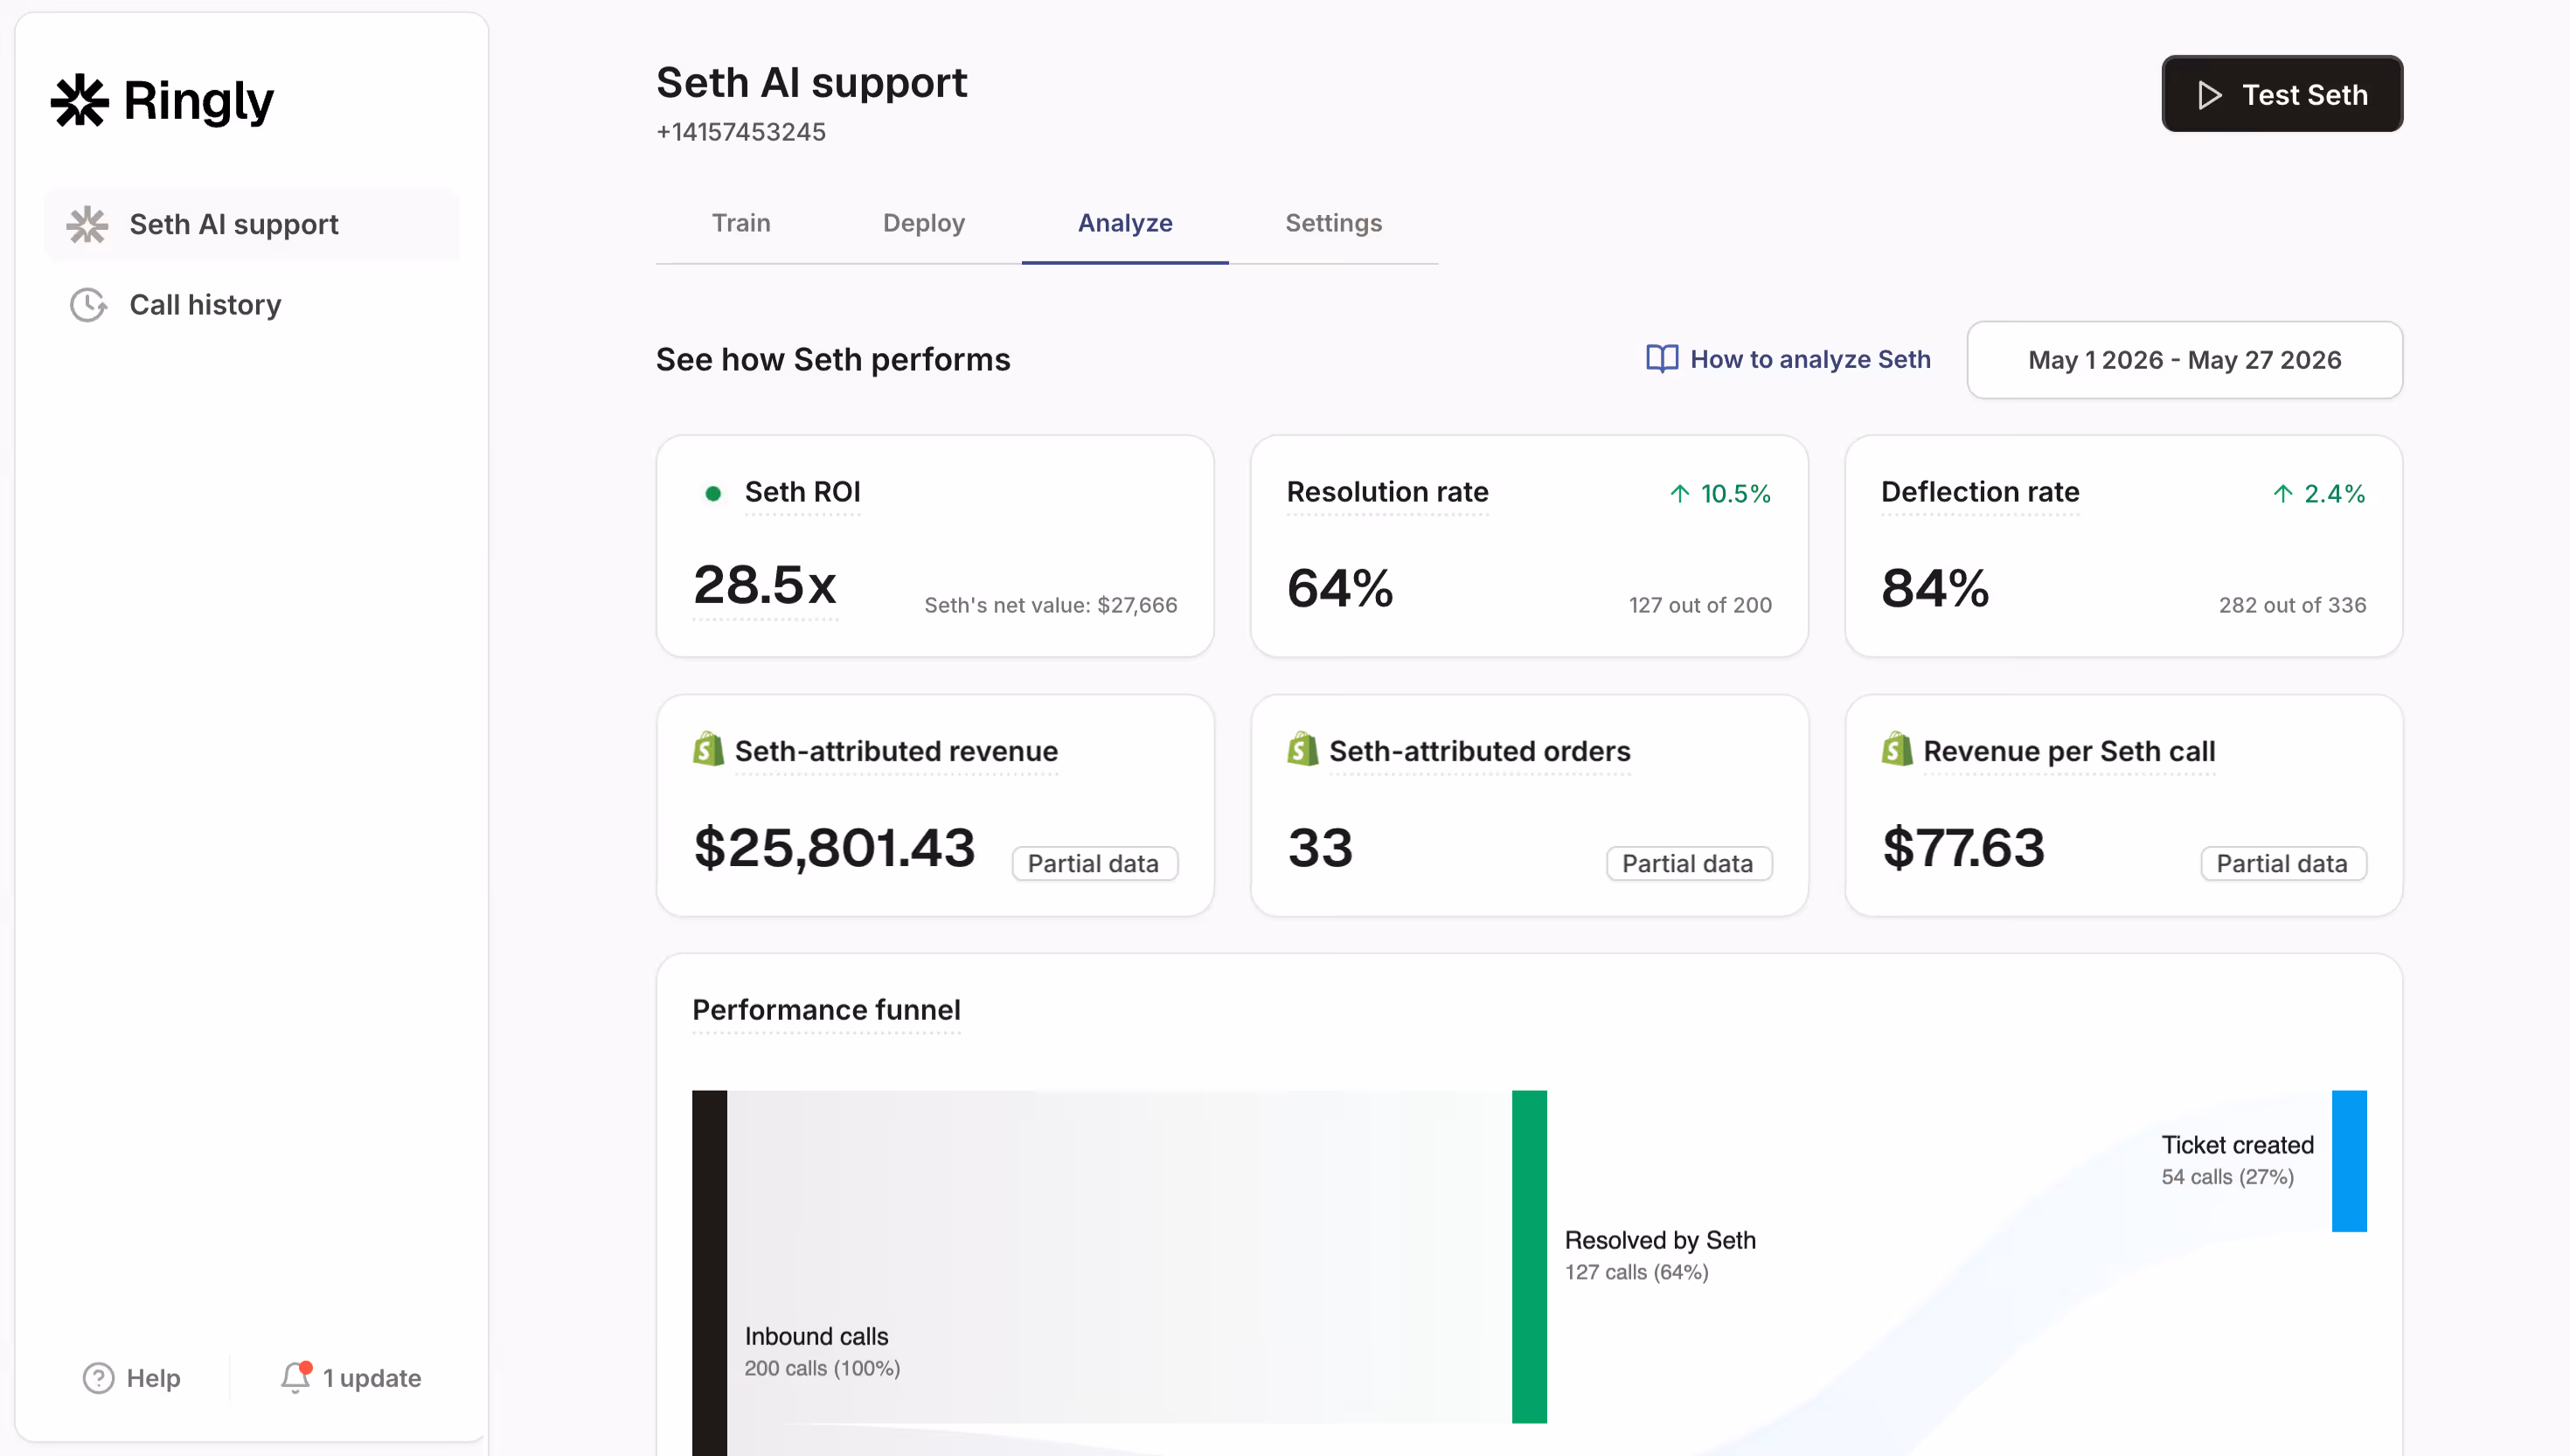
Ringly.io offers the AI, an AI phone support agent built specifically for ecommerce stores.
The AI handles inbound calls 24/7, answering questions, looking up orders, processing returns, and escalating only when necessary.
The system integrates directly with Shopify and resolves around 73% of calls without human intervention.
Here is why this pairs well with solid demand forecasting. When your forecasting is dialed in, you know what customers want.
When The AI handles your phones, you ensure those customers get answers immediately, even at 2 AM.
The combination means you are prepared for demand and equipped to serve it.
the AI speaks 30 languages, works with your existing phone number or provides a new one, and most stores go live within an hour without coding.
For stores scaling past the point where founder-led support is sustainable, it is worth exploring. You can start a free 14-day trial here.
Frequently Asked Questions
What is ecommerce demand forecasting and why do I need it?
Ecommerce demand forecasting is the process of predicting future sales using historical data, seasonality patterns, and market trends. You need it to avoid stockouts that lose sales and overstock that ties up cash. Accurate forecasting helps you maintain the right inventory levels, improve cash flow, and keep customers happy by having products available when they want them.
How accurate can ecommerce demand forecasting actually be?
Accuracy varies by method and data quality. Simple moving averages might achieve 70-80% accuracy. Advanced AI-powered tools like Prediko claim 93-97% accuracy for businesses with solid historical data. The key is measuring your own forecast error rate and continuously improving. Even being 80% accurate beats guessing.
What data do I need for ecommerce demand forecasting?
At minimum, you need historical sales data by SKU, current inventory levels, and seasonality patterns. Better forecasts add customer behavior data, marketing spend history, supplier lead times, and external factors like promotions or competitor activity. Clean, consistent data matters more than complex models.
When should I move from spreadsheets to dedicated forecasting software?
Consider software when manual forecasting takes more than a few hours weekly, when you manage hundreds of SKUs across multiple channels, or when forecast accuracy directly impacts significant revenue. Most growing ecommerce businesses hit this point between $1-5 million in annual revenue.
How often should I update my ecommerce demand forecasts?
Update weekly at minimum for most businesses. Daily updates are better for volatile categories, new product launches, or during peak seasons like Q4. Monthly updates are too slow for ecommerce. The faster your business moves, the more frequently you should refresh your forecasts.
Can ecommerce demand forecasting help with cash flow planning?
Absolutely. By predicting sales and inventory needs, forecasting helps you anticipate cash requirements for purchasing stock, plan for seasonal fluctuations, and avoid tying up excess capital in unsold inventory. Financial forecasting ties demand predictions directly to cash flow projections.
What is the biggest mistake businesses make with demand forecasting?
The biggest mistake is relying on category-level averages instead of SKU-level data. A product category might show steady 10% growth while individual SKUs swing from +50% to -30%. Aggregate data hides the specific insights you need to make good inventory decisions. Always forecast at the SKU level.