
This post in 30 seconds.
- Most "reduce returns" advice is really about the returns process, a slicker portal, faster refunds, exchange-first flows. This is about the rate itself: fewer returns happening in the first place.
- Around one in five online orders comes back, and 86% of those returns are decided before the customer ever clicks buy. That's where the wins are.
- Built for founders, COOs, and Heads of CX at $10M-$100M Shopify brands where returns quietly eat margin and nobody on the team owns the number.
Returns are the line item nobody fights for. Marketing owns acquisition. Ops owns fulfillment. Finance owns the P&L. The return rate just sits there, climbing a point or two a year, and the cost gets buried across shipping, labor, and refunded revenue until someone in finance finally asks why gross margin slipped.
Here's the split that matters. Reducing returns has two halves. One is the returns process, what happens after a customer decides to send something back: the portal, the label, the refund, the restock. The other is the return rate, how many customers decide to send something back at all. Almost every tool in this category sells you the first one. This post is about the second.
If you run customer experience or operations at a Shopify brand doing $10M to $100M, you already know the obvious moves: add a size chart, improve the photos, tighten the policy. Most of those are done. So this goes a level deeper into where returns actually start and which levers move the rate without choking conversion. If you want to see which lever would move your specific rate, book a 30-min call and we'll do the math against your numbers.
In this post:
Why returns happen, and why 86% is decided before checkout
You can't lower a number you don't understand. And the return rate is an average of very different problems hiding under one figure. A 30% rate driven by "doesn't fit" is a completely different operational problem than a 30% rate driven by "arrived damaged." The first is a product-page and sizing problem. The second is a carrier and packaging problem. As Shopify's returns benchmark lays out, that's the reason every serious returns-reduction effort starts with reason data, not a blanket policy change.
Here's the breakdown that holds across most DTC categories, pulled from Shopify's returns benchmark and Outvio's reasons-for-returns data:
| Return reason | Share of returns | Where it starts |
|---|---|---|
| Size, fit, or color mismatch | ~45% (60-70% for apparel) | Product page + sizing data |
| Damaged in transit | ~16% | Packaging + carrier |
| Not as described | ~14% | Photos, copy, expectations |
| Quality below expectations | ~10% | Product + expectation gap |
| Change of mind | ~11% | Pre-purchase certainty |
Roughly 86% of returns trace back to the first three causes, and all three are decided before the customer hits buy. Sizing, description accuracy, and the gap between what the photo promised and what showed up. That's the VNTANA figure, and it reframes the whole problem. Most teams treat returns as a post-purchase event to be processed efficiently. The data says they're a pre-purchase decision you can shape.
Then there's bracketing, the behavior that quietly doubles your apparel return rate. A customer isn't sure between a medium and a large, so they order both, keep one, send one back. You paid to ship two, you pay to process one back, and your "return rate" was never about a product flaw at all. It was about a sizing answer the page didn't give them with enough confidence to commit to one size.
What returns actually cost your brand
Before you pick a lever, get honest about what each avoided return is worth. The headline number most people quote is the refunded revenue. That's the smallest part.
The cost to process a single ecommerce return runs $10 to $30 in most categories, and up to $65 for bulky or complex items, according to retail returns data from MakeMyReceipt. That covers reverse logistics, receiving labor, inspection, restocking, the refunded payment-processing fee you don't get back, and the customer-service time spent on the return. Reverse logistics alone can run 20% to 30% of the original item's value, per SmartRoutes.
Across a full catalog, returns and reverse logistics quietly consume 12% to 15% of revenue at some retailers. For a $50M brand, that's $6M to $7.5M lost to a line item nobody owns. And the scale isn't niche: US consumers were projected to return close to $890 billion in merchandise in a single year, per the NRF.
The point isn't to scare you. It's to fix the mental model. A return doesn't cost you the refund. It costs you the refund, the round-trip shipping, the labor to handle it, the restock or write-off, and the margin on a sale that's now negative. When you size the prize that way, even a one-point reduction in the rate is worth chasing.
The returns-reduction math: what a 4-point drop is worth
Let's put real numbers on it. Take a brand doing $20M in revenue with a 22% return rate, average order value around $90, and a blended cost of $25 per processed return.
| Line item | Today (22% rate) | After (18% rate) |
|---|---|---|
| Annual orders (~$90 AOV) | ~222,000 | ~222,000 |
| Returns processed | ~48,840 | ~39,960 |
| Processing cost ($25 each) | ~$1,221,000 | ~$999,000 |
| Returns avoided | n/a | ~8,880 |
| Direct processing savings | n/a | ~$222,000/yr |
And that's just the processing cost. It doesn't count the recovered margin on orders that now stick, or the customers who would have churned after a frustrating return and instead stay. A four-point drop on a $20M brand is a quarter-million dollars before you've touched the upside on retention.
This is also where the phone channel earns its place, which we'll get to. WashCo, a Shopify brand we launched, recovered $22,664 in its first 7 days on the phone by catching orders that would otherwise have slipped away, the same channel that, used well, talks a hesitant buyer into the right size instead of two sizes. Lowering returns and recovering revenue turn out to be the same conversation, just on opposite sides of the buy button.
If returns are draining margin and you want to see what a few points back looks like against your real numbers, book a 30-min call and we'll run the math live.
How I built this playbook
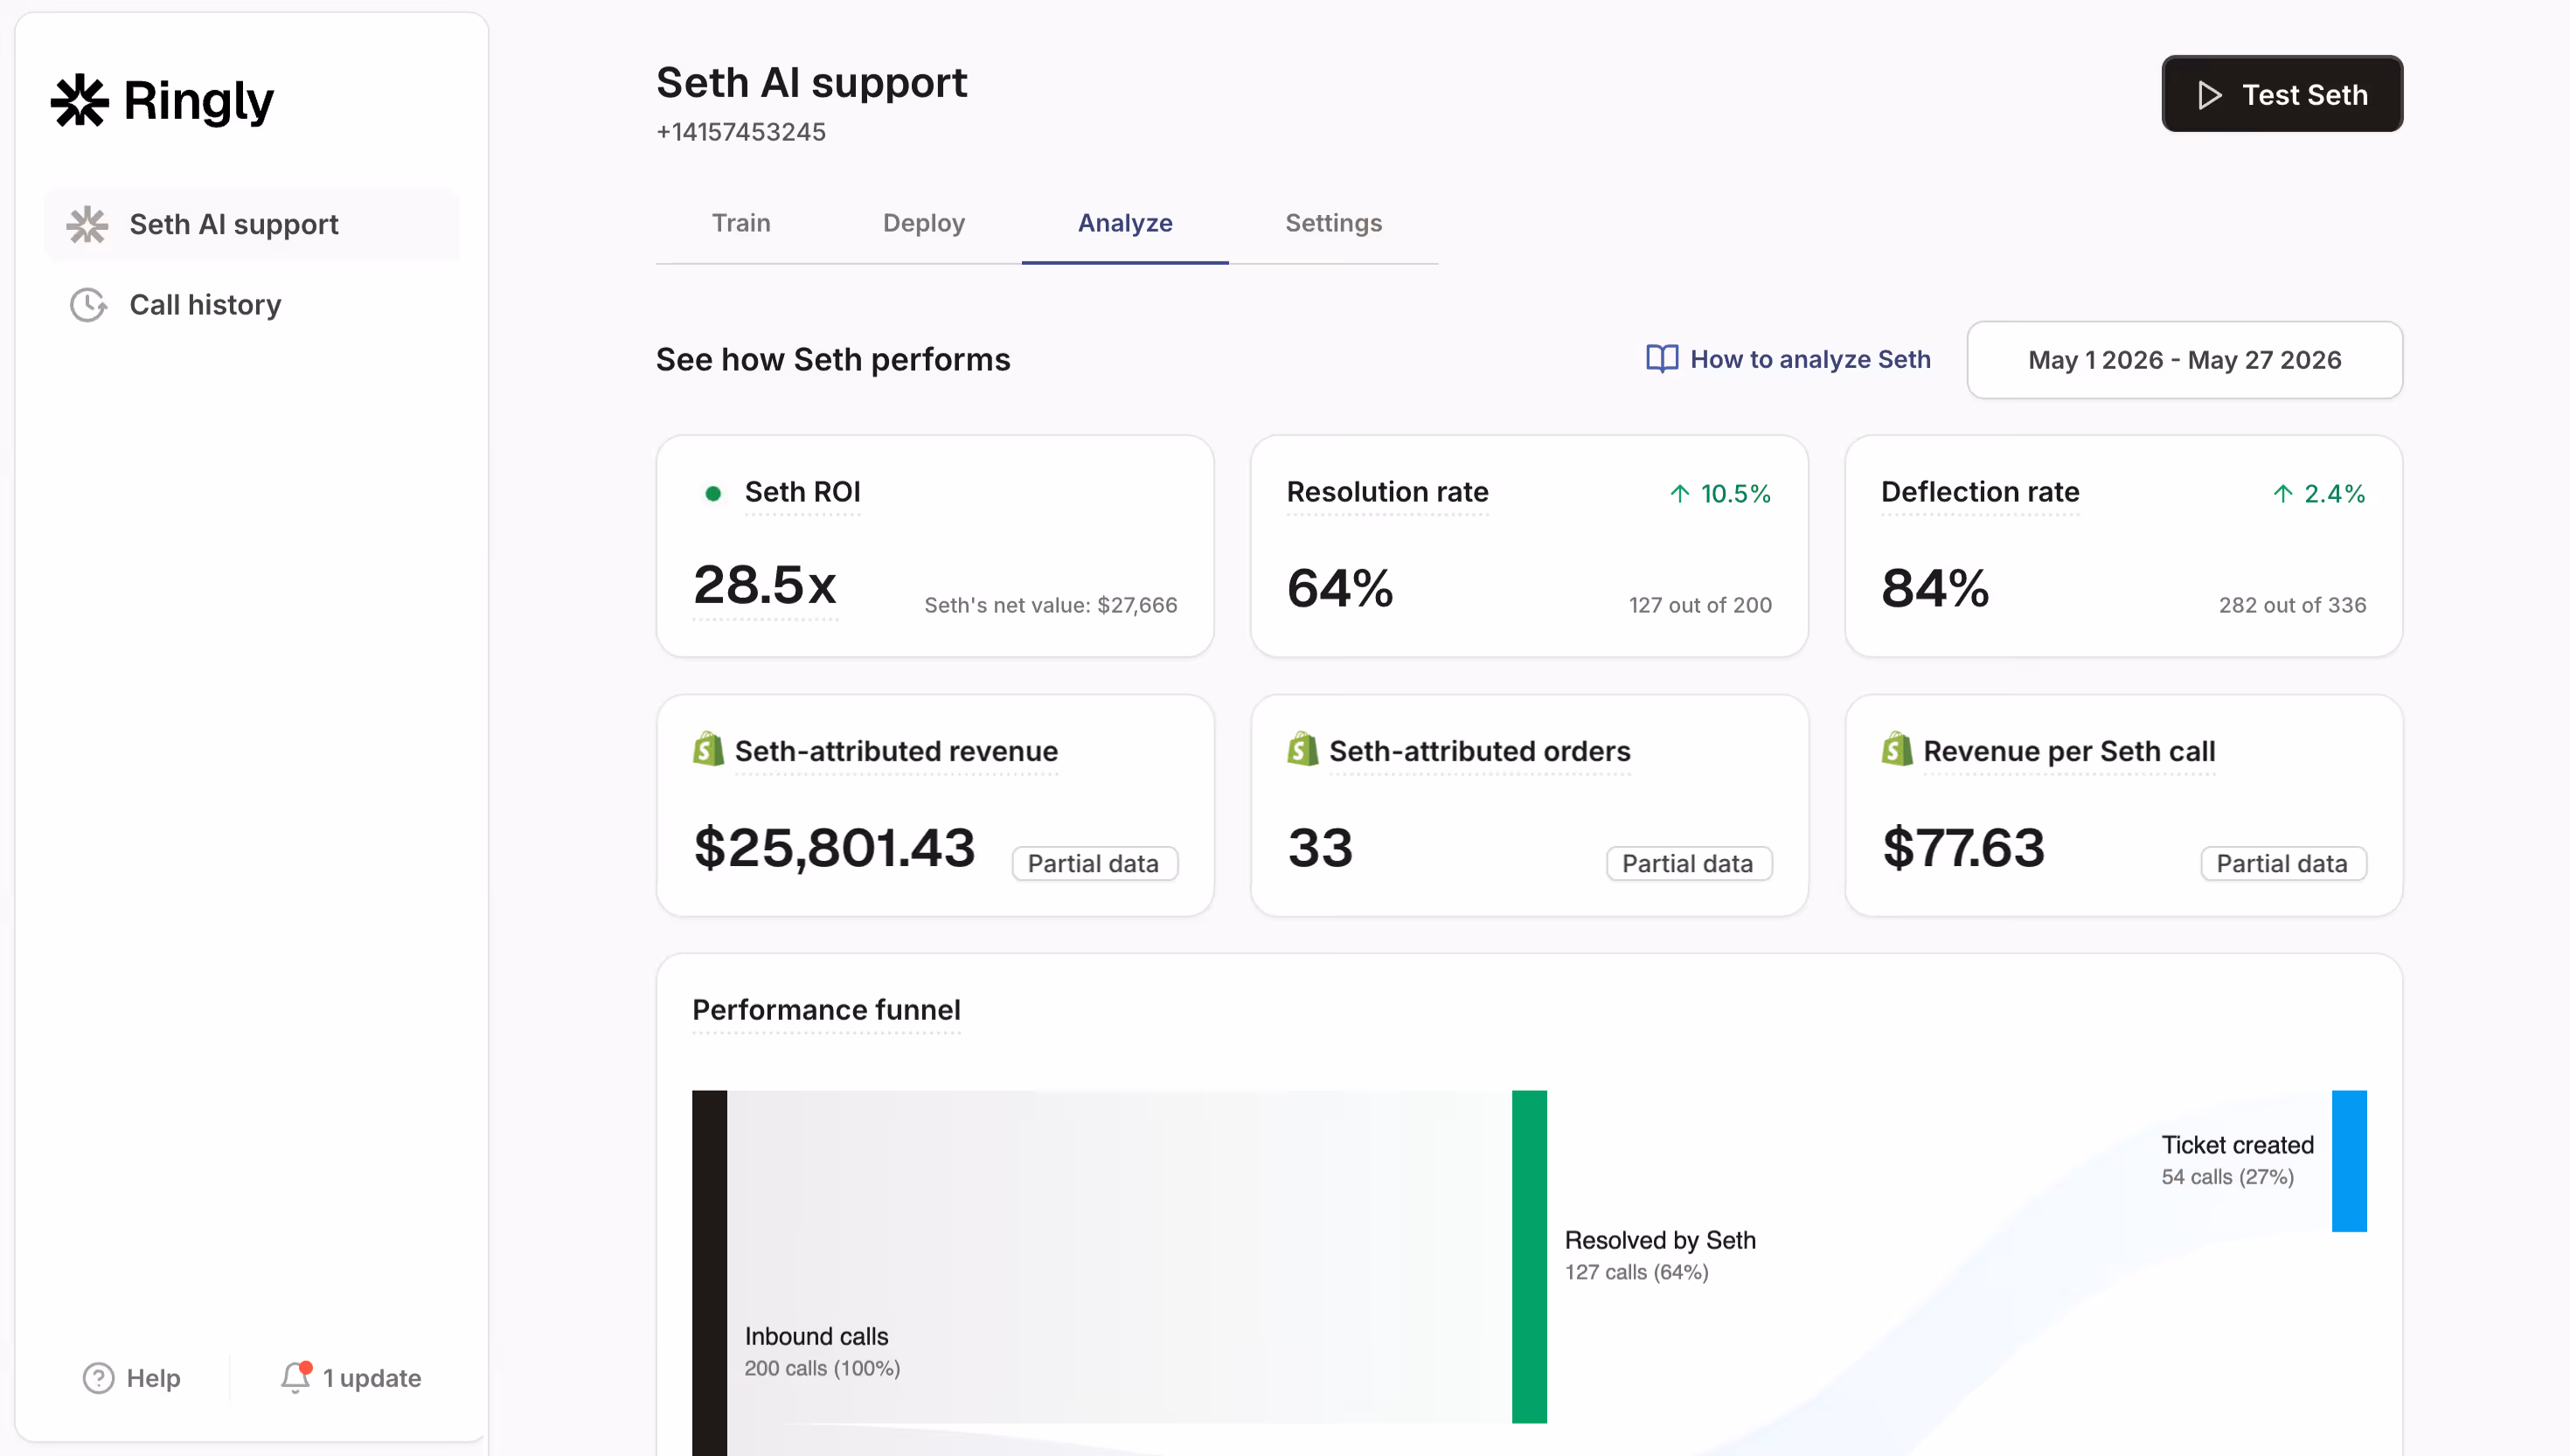
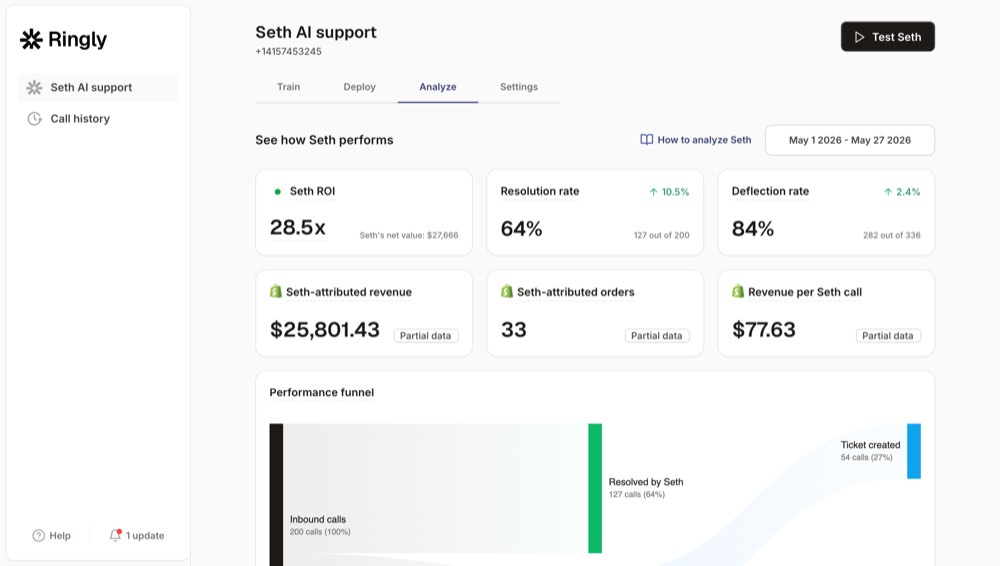
I'm Ruben, co-founder of Ringly.io. We run AI phone support for 50+ Shopify brands, which means I spend a lot of time in two places most returns articles never look: real return-reason data and real customer call transcripts.
The levers below aren't a brainstorm. They're filtered. Here's how I built the list:
- I started with reason data, not opinions. A lever only made the list if it targets a cause that actually shows up in real return-reason tagging, sizing, description accuracy, expectation gaps. Tactics that sound smart but address a 2% cause didn't make it.
- I kept levers that moved the rate on more than one brand. A trick that worked once is luck. The levers here showed up across multiple brands' results, not a single case study.
- I read the call logs. This is the part nobody else has. When you read a few hundred real support calls, a pattern jumps out: the customer who calls before buying to ask "will this fit me?" or "is this the right one for my situation?" is the same customer who would have returned the order if no one picked up. The phone line is the earliest returns signal a brand has, and almost nobody mines it.
- I ordered by impact, not by convention. Most lists put "add a size chart" at the top because it's easy to say. I ordered by what actually moves the rate for a $10M-plus catalog.
That last point about the call logs is the one I'd push back on the hardest if someone told me it didn't matter. A question a customer had to call about is a question your product page failed to answer. Fix the page, and you fix the return before it happens.
The prevention levers, ordered by impact
Here's the playbook. Work them roughly in order, but pick based on your own reason data, not mine.
Make the product page tell the whole truth
Most "not as described" returns aren't lies. They're omissions. The page didn't mention the fabric weight, the true color in natural light, the actual dimensions, or how the thing fits a real body. The single highest-impact move on most catalogs is per-size measurements instead of a generic S/M/L chart, paired with photos on diverse body types and a clear "runs small / true to size / runs large" note. Shopify's own community threads on apparel sizing put fit issues at 60-70% of apparel returns, and the fix is rarely a fancier tool. It's honest, specific information on the page.
If you sell anything where shape and scale matter, interactive 3D and 360-degree spin views are worth testing. A 2026 analysis cited by VNTANA found spin views cut returns by roughly 37% on average, with furniture near 39% and jewelry near 42%. The mechanism is simple: fewer surprises on the doorstep.
Triage your most-returned SKUs
Don't try to fix the whole catalog. Pull your top 10 most-returned products and treat each one as its own problem. One might have a bad measurement on the page. Another might have a photo that oversells the color. A third might have a genuine quality issue your supplier needs to hear about. The fix is almost never the same across SKUs, which is exactly why brands that "improve product pages" across the board see less movement than brands that fix the ten worst offenders one at a time. This is the highest-ROI weekend a CX lead can spend.
Let reviews and fit data do the selling
Customer-reported fit data is more persuasive than anything you write yourself. A "true to size" badge backed by 400 buyers beats your own size guide. Surface review snippets that mention fit, quality, and accuracy right on the product page, and let buyers who've already returned tell the next buyer what to expect. AI sizing recommenders push this further: Parcel Perform reports that brands using AI sizing tools see return-rate reductions of 25% to 50% depending on category, and nearly half of US apparel retailers have already adopted some form.
Set expectations before and after the sale
A return is a gap between expectation and reality. You can close it from both sides. Before the sale, be precise about shipping timelines, what's included, and how the product is meant to be used. After the sale, a short "here's how to get the most out of it" touch can turn a confused, about-to-return customer into a happy one. This is the change-of-mind and quality-perception bucket, roughly a fifth of returns, and it's the one most teams ignore because it lives after checkout where nobody's measuring.
Mine what your phone line already knows
Every pre-purchase call is a returns forecast. When a customer calls to ask whether a product will fit, work, or suit their situation, they're telling you the page didn't answer it, and they're about to either not buy or buy-and-return. Answer it well at that moment and you do two things at once: you save the sale and you prevent the return. Then you feed those questions back into the product page so the next 1,000 buyers don't have to call.
Post-purchase, the phone does the other half. A customer who calls saying "I think I want to send this back" is rarely set in stone. Handled with reassurance, a how-to-use tip, or an exchange instead of a refund, a meaningful share of those calls end with the order kept or swapped, not returned. That's the lever almost no returns article covers, and it's why we built the next section around it.
Design a conditional return policy
Blanket free returns punish your margin. Blanket paid returns punish conversion. The answer most operators land on is conditional: free for defects and exchanges, a modest fee for change-of-mind returns, per Claimlane's policy guidance. It nudges bracketers toward committing to one size without making genuine problems feel like a fight. Pair it with a clear, generous exchange path, because an exchange keeps the revenue and a refund doesn't. Our own breakdowns of return policy impact on orders and returns best practices go deeper on the wording.
If you want a second set of eyes on which of these would move your rate fastest, book a 30-min call.
The phone line is your cheapest returns-prevention tool
Most brands think of the phone as a support cost. For returns, it's the opposite: it's the one channel that catches a return-bound order while you can still do something about it.
Ringly.io is AI phone support for Shopify brands. Keep your current number, your helpdesk, and your workflows. Add an AI that handles the routine inbound calls so your team can focus on the work that actually moves revenue. The AI answers 24/7, checks order status in your Shopify store, answers product and fit questions from your knowledge base, handles exchanges and returns, and escalates the calls that actually need a person to Gorgias, Richpanel, or whatever helpdesk you already run.
Here's how that maps to returns specifically:
- Pre-purchase fit and "is this right for me" calls get answered accurately, at the moment of decision, so the customer buys the right thing once instead of bracketing two sizes or buying-and-returning.
- Post-purchase "I want to return this" calls get de-escalated with reassurance, usage guidance, or an exchange offer, which keeps the revenue a refund would lose.
- Your call logs surface the exact product-page gaps driving returns. Every question a customer had to call about is a question the page should have answered. Fix the page, prevent the next batch of returns.
What it won't do: it won't fix a bad photo, repair transit damage, or replace good measurements on the page. It's one lever, not the whole answer. But it's the cheapest one, because it runs at roughly $0.42 per resolved call versus $7 to $16 per call for human BPO, and it catches the return at the only moment it's still preventable.
"My customers also feel like it's a normal person. They feel like they can communicate if they have questions."
Claudia Droge, TechCraft Studio
Across 50+ brands, the AI resolves 73% of inbound calls on its own. Plans run Grow at $349/mo and Pro at $799/mo, with Enterprise set by call for $10M-$100M brands. Every plan carries a 65% resolution guarantee: if the AI resolves under 65% of your calls in 90 days, we refund the last 3 months. If you've been burned by a chatbot that pretended to be a phone agent, our take on voice AI that actually works is worth a read.
How to measure your returns-reduction program
If you only track the headline return rate, you'll fly blind. The rate goes up during a launch, down in a slow month, and the noise hides whether your levers are working. Track these instead:
- Return rate by SKU and by reason. This is the prerequisite for everything. Tag every return with a reason and you'll see which products and which causes to attack. Reason data is the metric that actually matters, since a rate without a cause behind it tells you nothing about what to fix.
- Bracketing rate. What share of multi-item orders return all but one size? If it's high, your sizing confidence is low.
- Exchange-to-refund ratio. Exchanges keep revenue. A rising ratio means your post-purchase handling is working.
- Net margin per order, after returns. The number finance actually cares about. A "good" return rate is one that protects this, not one that hits an arbitrary percentage.
On benchmarks: overall ecommerce return rates sit near 20% in 2026, but the only number that matters is your category's. Beauty and supplements run under 7-10%, electronics 8-12%, home goods near 19%, and apparel anywhere from 18% to 28%, per category data from Eightx. For a deeper benchmark set, our ecommerce return statistics for 2026 breaks it down by category. Good means below your category average and trending down, not a universal target.
Set a 90-day baseline, pick three levers from the list above, and measure against your own number. If you want help reading the call-log side of the picture, that's exactly what we do. For the broader retention angle, our guide to ecommerce customer retention connects returns to repeat-purchase rate, and the tactical checklist of return-reduction tactics covers the step-by-step.
Frequently asked questions
What is a good ecommerce return rate? There's no single good number, because the rate is mostly set by your category. Beauty and supplements should aim under 7-10%, electronics 8-12%, and apparel 18-28%. Good means you're below your category average and the rate is trending down.
What causes the most product returns? Size, fit, or color mismatch is the biggest single cause at roughly 45% of returns, and 60-70% for apparel specifically. Damaged-in-transit and "not as described" follow. About 86% of returns trace to causes that are decided before checkout.
How do you reduce returns without hurting conversion? Focus on accuracy, not friction. Better measurements, honest photos, and fit data raise conversion and lower returns at the same time, because customers buy with realistic expectations. The levers that hurt conversion are the blunt ones, like a stricter blanket policy, so use conditional rules instead.
Does a stricter return policy reduce returns? A blanket strict policy can lower returns but usually costs you conversion and repeat customers. A conditional policy works better: free for defects and exchanges, a small fee for change-of-mind returns. It nudges bracketers without punishing genuine problems.
How much does a return actually cost? Most ecommerce returns cost $10 to $30 each to process, and up to $65 for bulky items. That includes reverse logistics (often 20-30% of item value), receiving labor, restocking, the lost payment-processing fee, and customer-service time. The refunded revenue is only part of it.
Can AR or 3D product views really reduce returns? Yes, for products where shape and scale matter. Interactive 3D and 360-degree spin views have been shown to cut returns by roughly 37% on average, higher for furniture and jewelry. They work by removing the surprises that drive "not as described" returns.
How can phone support reduce returns? Pre-purchase, answering fit and "is this right for me" questions accurately helps customers buy the right thing once instead of bracketing or buying-and-returning. Post-purchase, a reassurance or exchange call turns a meaningful share of "I want to return this" moments into kept or swapped orders. The call logs also surface exactly which product-page gaps are driving returns.
How long before returns-reduction efforts show results? Policy changes show impact almost immediately. Photo and description fixes show measurable movement in 4-8 weeks. Sizing tools and 3D content take 8-12 weeks to produce clean data, since you need enough orders through the new experience to read the rate.
Which product categories have the highest return rates? Apparel and footwear lead at 18-28% online, driven by sizing. Home goods and furniture run high too because of damage and scale surprises. Beauty, supplements, and pet products tend to be lowest, often under 10%.
Talk to us

If returns are quietly draining your margin and nobody on the team owns the number, a 30-minute call is the fastest way to see which of these levers moves your rate, and how much of it your phone line is already telling you.
The 3-layer guarantee.
- Live in 14 days or it's free until launched.
- 65% resolution in 90 days or we refund the last 3 months of subscription fees.
- We keep working free until we hit 65%.
Ruben (Ringly co-founder) takes these calls personally.