
The short version.
- Most call center KPI guides hand you 38 metrics. You need about six.
- The KPI that moves the most revenue for a DTC brand barely makes the generic lists: the share of inbound calls you actually answer. Businesses answer only 37.8% of theirs.
- Built for founders, COOs, and Heads of CX at $10M-$100M Shopify brands running a paid helpdesk and a visible phone line.
You don't have a metrics problem. You have a too-many-metrics problem.
Open any "definitive list" of call center KPIs and you'll get 29, or 38, or 50 numbers with a formula next to each one. Genesys lists 29. Zoom lists 38. None of them tell you which six to put on a dashboard and actually run your week against. So most teams track everything and change nothing.
This is written for the person on the other side of that problem: the founder or Head of CX at a $10M-$100M Shopify brand, with a paid helpdesk like Gorgias and a phone number sitting in the footer that somebody is supposed to answer. You already know the Monday queue. You're measured on a resolution rate you can't cleanly report because the data is split across Gorgias, Shopify, your 3PL, and a doc one rep maintains by hand.
Below are the 12 call center KPIs that actually matter in 2026, the benchmark to target for each, and the five-to-seven you should pick if you want a dashboard you'll actually use.
I read 50+ real call logs from Shopify brands we run phone support for to write this. The KPI that mattered most wasn't average handle time. It was whether the call got picked up at all.
If you want to skip the reading and see what your own phone line is leaking after-hours, book a 30-min call and we'll walk your last seven days of calls with you. No deck.
What a call center KPI actually is (and why DTC is different)
A metric is any number you can measure. A KPI is a metric you've tied to a goal and agreed to act on. "We logged 1,400 calls last month" is a metric. "We resolved 71% of them on the first contact, up from 64%" is a KPI, because there's a target and a decision behind it.
That distinction matters more for a Shopify brand than it does for a telecom, because most published call center benchmarks were built for industries where a phone call is a cost to contain, not a sale to save. For a DTC brand with a $30+ AOV, an inbound call is often a customer with a credit card and a question. Treat it like a ticket to deflect and you lose the order.
Two things make DTC different from the generic playbook:
- Your phone volume tracks your AOV, not your headcount. Higher-ticket stores get far more pre-purchase and order-status calls per order. A $250-AOV store sees a call on 12-18% of orders versus around 3% at a $40 AOV.
- Blended CSAT lies to you. A shipping delay or an out-of-stock tanks the score on a call your rep handled perfectly. SupportZebra's 2026 ecommerce guidance is blunt about it: track CSAT by category, not one blended number, or you'll "fix" the wrong thing.
So the generic targets are a starting point, not gospel. The right KPI set for a Shopify brand leans toward resolution and revenue recovery, not raw speed.

It's also why the after-hours window matters so much for DTC and barely registers in a telecom dashboard. Your customers shop at 11 p.m. Your call center KPIs should know what happens to the calls that land then.
How I picked these 12 (and read 50+ real call logs)
I'm Ruben, co-founder of Ringly. We run AI phone support for 50+ Shopify brands, which means I get to look at real call data instead of guessing from a vendor blog.
For this list, I did four things:
- Read 50+ real call logs from brands we run, tagging each call by what the customer actually wanted (order status, return, product question, escalation) and whether it got resolved.
- Pulled the 2026 benchmark targets from the published industry sources, so each KPI below has a number to aim at, not just a definition. Cross-checked Nextiva, CloudTalk, and Salesforce where they disagreed.
- Mapped each metric to a DTC outcome (recovered revenue, lower CS payroll, retained customer) and dropped the ones that only matter to a 500-seat BPO.
- Counted how often each metric actually changed a decision in those brands. The vanity ones got cut.
The finding that surprised me: the number that moved the most revenue wasn't on most lists at all. It was the share of inbound calls that got answered. Plenty of brands had a fine handle time on the calls they picked up, and a quietly catastrophic answer rate on the ones they didn't.
The 12 call center KPIs that matter in 2026
Here's the full set with a 2026 target for each. The table is the skim version. The detail and the formulas are below it.
| KPI | What it measures | 2026 target | Why it matters for DTC |
|---|---|---|---|
| First contact resolution | Issues solved in one contact | 70-80% | Repeat contacts cost more and churn customers |
| CSAT | Satisfaction with the interaction | 75-85% (retail 85-90%) | Track by category or it lies |
| NPS | Likelihood to recommend | Industry-relative | Loyalty leading indicator |
| Customer effort score | How hard it was to get help | Lower is better | DTC buyers pay for convenience |
| Call answer rate | Share of inbound calls answered | 90%+ | The biggest revenue leak nobody lists |
| Call abandonment rate | Callers who hang up before an agent | under 5-8% | Lost orders, not just lost calls |
| After-hours coverage | Calls handled outside business hours | as close to 100% as you can | Your customers buy at 11 p.m. |
| Average handle time | Time per call plus wrap-up | ~6 min | Useful, but resolution beats speed |
| Average speed of answer | Wait time before pickup | ~28 sec | Past 60 sec, people hang up |
| Service level | % answered within a time target | 80% in 20 sec | The classic 80/20 |
| Cost per resolved call | Loaded cost per solved call | as low as quality allows | The real efficiency number |
| Agent occupancy and turnover | Productive time and team churn | 85-90% occ; turnover low | Burnout shows up here first |
Customer-experience KPIs
These tell you whether the call left the customer better off. For a DTC brand they're the ones the founder feels personally, because a bad one ends up screenshotted on Twitter.
1. First contact resolution (FCR)
Best for: the single most important quality KPI for an ecommerce brand.
FCR is the percentage of issues solved on the first contact, with no callback, no second ticket, no "let me check and get back to you." Formula: resolved-on-first-contact divided by total contacts.
The 2026 benchmark is 70-74% as a standard, with the strongest teams at 80% per Nextiva's benchmark data. High-performing ecommerce teams land in the 70-85% range depending on how complex their catalog is. Every point of FCR you gain is a customer who didn't have to call twice, and a rep-hour you got back. It's the KPI I'd put first on any ecommerce customer service dashboard.
2. Customer satisfaction (CSAT)
Best for: the headline quality number, with one big caveat.
CSAT is the post-interaction rating, usually a 1-to-5 or thumbs survey. A good score sits between 75% and 85%, and retail leaders push 85-90%. Worth knowing: 95% of contact-center professionals call CSAT their most important metric, according to Salesforce.
The caveat for DTC: blended CSAT punishes your reps for things they don't control. A late package drags the score on a call the agent handled perfectly. Track CSAT by category (shipping, returns, product) so you can tell a rep problem from a logistics problem.
3. Net promoter score (NPS)
Best for: a loyalty signal that predicts repeat purchase.
NPS asks how likely a customer is to recommend you, scored 0-10, then nets promoters against detractors. There's no universal target, it's industry-relative, but the trend line is what you watch. A rising NPS usually shows up as a rising repeat-purchase rate a quarter or two later, which is why it earns a spot even though it's slower to move than CSAT. It pairs naturally with the wider set of customer service KPIs every ecommerce store should watch.
4. Customer effort score (CES)
Best for: spotting friction your CSAT misses.
CES measures how hard the customer had to work to get their problem solved. Lower is better. DTC buyers value convenience over almost everything, so a high-effort experience churns them even when they end up satisfied. If your CSAT looks fine but retention is soft, CES is usually where the answer is hiding.
The revenue-leak KPIs (the ones generic lists bury)
This is the group most call center KPI guides scatter and underweight. For a Shopify brand, these are the ones with a dollar figure attached. I'd argue they belong at the top, not buried at metric 9.
5. Call answer rate
Best for: the most important revenue KPI almost nobody lists first.
This is simply the share of inbound calls a human (or your AI) actually picks up. Here's the number that should bother you: businesses answer only 37.8% of their inbound calls, with another 37.8% going to voicemail and 24.3% getting nothing at all, per AmbsCallCenter. It's the same gap an after-hours answering service exists to close. For a store where a call is often a sale, that's not an operations stat. That's lost revenue you never see, because an unanswered call doesn't create a ticket. Your answer rate is the one KPI that's invisible in every other report, which is exactly why it leaks the most. Target 90% or higher.
6. Call abandonment rate
Best for: measuring the customers you almost served.
Abandonment is the percentage of callers who hang up before reaching anyone. Healthy is under 5-8%. The reason it matters: 60% of people hang up within 60 seconds on hold, and 90% are gone by five minutes, per Brightmetrics. Track it alongside your call abandonment rate statistics so a Monday spike doesn't hide inside a monthly average.
7. After-hours and missed-call revenue leak
Best for: the DTC-specific KPI that turns "missed calls" into a dollar number.
Most lists don't have this one because most call centers run shifts. DTC brands usually don't. So the practical KPI is: what share of your call volume lands outside business hours, and what happens to it? Right now, for most brands, the answer is voicemail nobody returns. WashCo, a Shopify brand we launched, recovered $22,664 in attributed revenue in its first 7 days once those calls actually got picked up. The point isn't the exact figure. The point is that the after-hours queue has a price, and until you measure it, you're paying it blind.
If you want to see what your own after-hours window is doing, book a 30-min call and we'll pull your last seven days of missed calls and put a number on it.
Operational-efficiency KPIs
These tell you how the machine is running. They're where most generic lists spend all their energy. Useful, but for DTC they're support acts, not the headline.
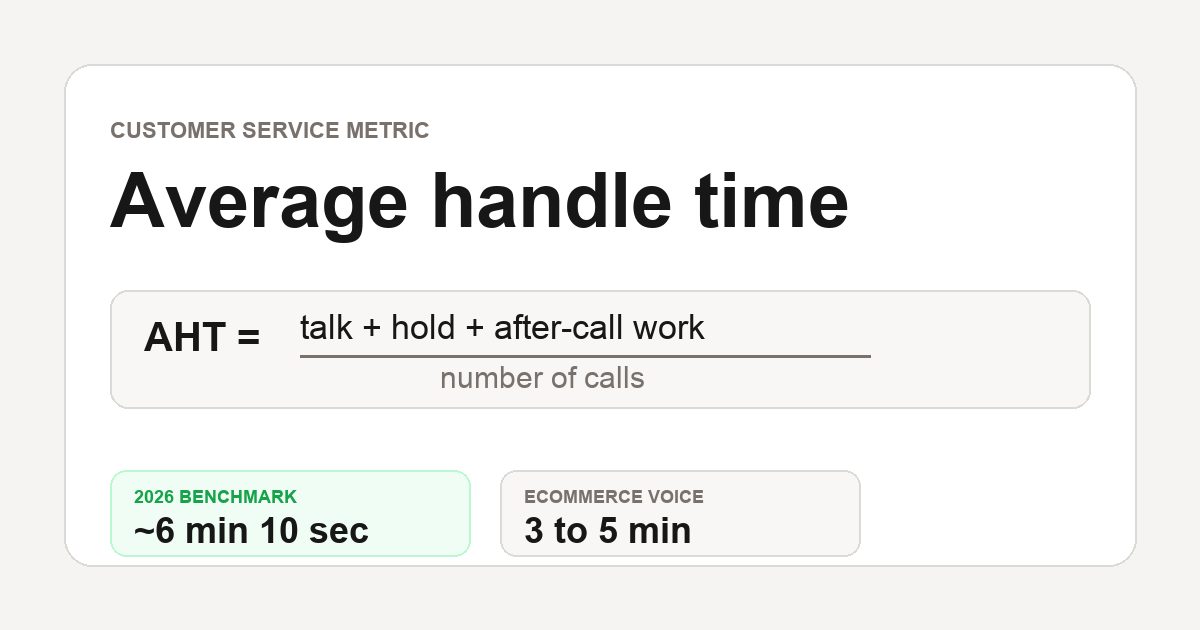
8. Average handle time (AHT)
Best for: capacity planning, not quality.
AHT is the average time per interaction including after-call wrap-up. The benchmark sits around 6 minutes, with 4-7 minutes typical for general service. But here's the trap: chasing a lower AHT can wreck your FCR. A rep who rushes a call to hit a time target creates a callback. Speed matters less than complete resolution, so watch average handle time as a capacity input, never as a quality goal.
9. Average speed of answer (ASA)
Best for: the wait-time number behind your abandonment.
ASA is how long a caller waits before someone picks up. The 2026 benchmark is about 28 seconds. It's tightly linked to abandonment, since most hang-ups happen inside the first minute. If your ASA is creeping up, your abandonment rate is about to follow.
10. Service level
Best for: a single staffing-health number.
Service level is the percentage of calls answered within a set time, classically 80% within 20 seconds (the "80/20 rule"). It's the fastest read on whether you're staffed for your volume. When it drops, you're either understaffed or hitting a spike you didn't plan for, like the day a paid creative triples your orders.
11. Cost per resolved call
Best for: the efficiency KPI that actually means something once AI is involved.
Most lists track cost per call. The better number is cost per resolved call, because a cheap call that didn't solve anything just creates a second, more expensive call. A loaded US rep runs about $2.70 per call; offshore BPO lands roughly $1.50-$3.50 once you count the contract overhead. For comparison, AI phone support resolves calls at roughly $0.42 each across the brands we run. The metric that tells the truth isn't what a call costs, it's what a solved call costs. This is the number to bring when finance asks about reducing call center costs.
Agent KPIs
12. Agent occupancy and turnover
Best for: catching burnout before it costs you a hire.
Occupancy is the share of logged-in time a rep spends actually handling contacts; 85-90% is healthy, and consistently above that means you're running people too hot. The number that hides underneath it is turnover. Replacing one CS rep costs around $14,113, and industry turnover runs above 31%. When occupancy stays pinned at 95%, turnover is the bill you pay three months later. It's the most expensive KPI on this list and the one teams track least.
Don't track all 12. Track these 5-7
Here's the part the 38-metric lists won't tell you: tracking everything is how you end up acting on nothing.
The operator consensus is to run five to seven core KPIs that cover satisfaction, speed, and revenue, then build your week around them. The winners aren't the brands with the fanciest dashboards. They're the ones who pick a few numbers, watch them closely, and change how they operate based on what they see.
Pick yours by what you're trying to fix:
- If you're trying to recover lost revenue: call answer rate, after-hours coverage, abandonment rate. These are the leaks.
- If you're trying to lift quality: FCR, CSAT-by-category, CES.
- If finance is asking about cost: cost per resolved call, AHT (as a capacity input), agent occupancy.
- If you're worried about your team: occupancy and turnover, full stop.
For most $10M-$100M Shopify brands, the right starting six are: answer rate, FCR, CSAT-by-category, abandonment, cost per resolved call, and after-hours coverage. That set spans every problem that actually costs you money. Add NPS once the first six are stable and you have time to watch a slower signal. If you want the wider context behind these targets, the 2026 call center statistics are a good companion read.
How to actually move these numbers without hiring
Most of the playbooks for improving these KPIs come down to "hire more reps and train them better." That works, until you do the math on a fifth rep at $4,000 a month loaded who takes six months to ramp and quits at month nine.
The other lever is taking the repeatable calls off your team entirely. About 70% of DTC call volume is the same handful of things: order status, returns, simple product questions, the same five over and over. Route those to an AI call center for Shopify and four of your KPIs move at once.
Ringly.io is AI phone support for Shopify brands. Instead of growing headcount every time call volume goes up, the AI answers inbound calls 24/7: it finds orders in your Shopify store, processes returns, answers product questions from your knowledge base, and escalates the genuinely hard calls to your team. Across 50+ brands, it resolves 73% of calls autonomously at roughly $0.42 per resolved call, and it picks up at 2 a.m. without a night shift.
Look at what that does to the shortlist:
- Answer rate and after-hours coverage go to near-100%, because the AI never sleeps. The biggest revenue leak closes first.
- Abandonment and ASA drop, because there's no hold queue for routine calls.
- FCR climbs, since order status and returns resolve in one contact every time.
- Cost per resolved call falls toward $0.42 instead of $2.70.
BioLongevity Labs, a supplement brand we run, resolves 79% of its calls autonomously. TechCraft Studio handles 88% without a human. And the thing customers say most often isn't "the bot was fast." It's that it didn't sound like a bot at all.
"My customers also feel like it's a normal person. They feel like they can communicate if they have questions."
Claudia Droge, TechCraft Studio
The math is straightforward. A typical $50M Shopify brand running a 6-rep CS team is spending about $24,000 a month on those reps.
| Line item | Today | With Ringly |
|---|---|---|
| 6 reps at $4K loaded per rep | $24,000/mo | n/a |
| Ringly (about $5K/mo) | n/a | $5,000/mo |
| Net monthly CS spend | $24,000/mo | $5,000/mo |
| Monthly savings | n/a | $19,000/mo |
| Annual savings | n/a | $228,000/yr |
That's roughly 70% of repeatable calls routed to the AI. The other 30%, the genuinely complex ones, still go to your CS team, who now have time to actually solve them. If you want to compare it against your current setup, book a 30-min call and we'll run your numbers live. You can see how it fits next to your existing helpdesk too, since it sits in front of Gorgias, not on top of it.
Frequently asked questions
What is the most important call center KPI?
For a generic call center, most pros say CSAT. For a Shopify brand, it's your call answer rate, because an unanswered call is lost revenue that never shows up in any other report. Pair it with first contact resolution.
What is a good first call resolution rate?
The 2026 benchmark is 70-74% as a standard, with the strongest teams at 80%. Ecommerce teams typically land between 70% and 85% depending on catalog complexity.
What is a good average handle time?
Around 6 minutes is the general benchmark, with 4-7 minutes typical for standard service. Don't chase a lower AHT at the expense of resolution, since rushed calls create callbacks.
How many call center KPIs should I track?
Five to seven. The winners pick a small set that spans satisfaction, speed, and revenue, then act on it. Tracking 30+ metrics is how teams end up changing nothing.
What's the difference between a call center metric and a KPI?
A metric is any number you can measure. A KPI is a metric tied to a goal you've agreed to act on. "1,400 calls" is a metric; "71% resolved on first contact, up from 64%" is a KPI.
What KPIs matter most for an ecommerce or Shopify brand?
Answer rate, after-hours coverage, abandonment, FCR, CSAT-by-category, and cost per resolved call. These are the ones with a dollar figure attached for a DTC store.
How do I measure cost per call?
Divide your total loaded support cost (salaries, benefits, tools, overhead) by the number of calls handled. The more useful version is cost per resolved call, since unsolved calls just create more calls.
Can AI improve call center KPIs?
Yes, and usually several at once. AI phone support pushes answer rate and after-hours coverage toward 100%, lifts FCR on routine calls, and drops cost per resolved call. It handles the repeatable 70% so your team owns the complex 30%.
Talk to us

If you run a $10M-$100M Shopify brand and your phone goes quiet after 6 p.m., a 30-min call is the fastest way to see what that's costing you. We'll pull your real call data and show you which KPIs are leaking revenue right now.
The 3-layer guarantee.
- Live in 14 days or it's free until launched.
- 65% resolution in 90 days or we refund the last 3 months of subscription fees.
- We keep working free until we hit 65%.
Ruben (Ringly co-founder) takes these calls personally.