
Line itemTodayWith Ringly6 reps × $4K loaded per rep$24,000/mon/aRingly (~$5K/mo)n/a$5,000/moNet monthly CS spend$24,000/mo$5,000/moMonthly savingsn/a$19,000/mo
That's the gap this guide is about. We run AI phone support for 50+ Shopify brands, and across all of them the pattern is the same: effort concentrates on the phone, and the phone is the channel nobody measures. Below is what customer effort score actually is, where the effort really hides in an ecommerce journey, and the fastest lever to bring it down.
Most teams track CSAT and call it a day. If your store does $10M+ on Shopify and keeps a phone line that goes quiet after 6 p.m., the metric you're missing is the one that predicts churn before the chargeback hits. Book a 30-min call and we'll show you what your after-hours calls are doing to it.
What customer effort score actually measures
Customer effort score (CES) measures how much work a customer has to put in to get a task done or an issue resolved. The lower the effort, the more likely they are to come back and spend more. It's a friction metric, not a happiness metric, and that distinction is the whole point.
The Corporate Executive Board (now Gartner) introduced it in 2010 in a Harvard Business Review piece called "Stop Trying to Delight Your Customers." Their finding was blunt: reducing effort drives loyalty far more reliably than exceeding expectations does.
You measure it with one question, asked right after an interaction. The current standard (CES v2.0) is "How easy was it to resolve your issue today?" answered on a 1-7 scale, where 7 is very easy. A lot of ecommerce teams use a simpler 1-5 scale instead, where 1 is very easy and 5 is very difficult. Both work. The only rule that matters is that you pick one and never switch, because the trend line is what you're actually managing.
The number that should make you care: 96% of customers who have a high-effort experience become disloyal, versus only 9% of those who had a low-effort one (Gartner / CEB, from a study of 97,000+ responses, via Gorgias). For a metric that gets filed under "soft," that's about the cleanest churn signal support owns.
Two ways to calculate it:
Why effort beats satisfaction as a loyalty signal
This is where CES earns its keep. As a predictor of whether someone comes back, it beats the two metrics you're probably already running.
CES is 1.8x more predictive of customer loyalty than CSAT, and 2x more predictive than NPS (Gartner / CEB). The reason is mechanical: CSAT captures how someone felt in a moment, and NPS captures how they feel about your brand in the abstract. Effort captures whether your operation actually worked. Mood fades. Friction compounds.
And the upside is real, not just the downside. 94% of customers who had a low-effort experience said they intend to buy again (Genesys / CEB). For a brand living on repeat purchase rate, that's the number on the P&L.
A customer who has to call three times, repeat their order number twice, and wait on hold doesn't remember your CSAT survey. They remember the friction. That's what shows up in your ecommerce customer retention numbers two months later. If you want the deeper data, we pulled it together in our customer effort score statistics roundup.
Where effort actually hides in an ecommerce journey
Most CES guides hand you a list of touchpoints and stop there. The list is real, so here it is. But the part they leave out is the part that costs you money.
Effort accumulates across the whole journey:
Journey stageWhere effort comes fromHow you'd catch itAccount / checkoutForced registration, clunky address entryFunnel drop-off + a post-purchase CES surveyPaymentFailed cards, no wallet optionsCheckout abandonment rateFulfillment / WISMO"Where's my order" with no tracking visibilityPost-delivery CES + WISMO ticket volumeReturnsHard-to-find policy, manual approvalPost-return CESSupport contactHold times, repeating yourself, voicemailCES by channel (the one nobody runs)
Now the thing the SERP doesn't say out loud. Effort is not evenly distributed across channels, and the people who reach your phone are already further up the effort curve than anyone else. 70% of customers try self-service before they ever contact support (Gartner). So by the time someone picks up the phone, they've already checked the FAQ, hunted through the tracking page, and given up. They're not starting at zero effort. They're starting annoyed.
That's why the phone is the channel where a bad CES does the most damage, and it's the one most DTC brands never measure. You can see your WISMO calls pile up in the queue. You can't see the ones that hung up.
The phone line is your highest-effort channel, and you're probably not measuring it
Walk through what actually happens after hours. A customer calls. Your team's gone home. The line rolls to voicemail. They leave a message, or they don't. Either way, nobody gets back to them tonight, and the routine ones (where's my order, can I change my address, did my return process) never needed a human in the first place.
The data on that moment is ugly. 85% of callers who can't reach a person never call back, and 62% switch to a competitor (PCN, 2026). 78% of buyers abandon a brand entirely after a single unanswered call. An unanswered call isn't a low score on your effort survey. It's the customer rating you the worst possible number and then leaving without telling you.
The maximum-effort experience your store can hand someone is the after-hours call that rings out and never gets returned, and it never shows up in your helpdesk because it never became a ticket. That's the blind spot. Your ecommerce phone support is generating effort scores you literally cannot see.
And it's not a small slice. WISMO alone runs 30-40% of support volume in normal weeks and 50%+ at peak (Salesforce). Add returns and product questions and you're looking at roughly 70% of phone volume that's repeatable, low-stakes, and exactly the kind of call that should never sit in a voicemail box overnight. WashCo, a Shopify brand we launched, recovered $22,664 in its first 7 days once those calls started getting answered instead of dropped.
If your phone goes quiet after 6 p.m., book a 30-min call and we'll walk through what your missed calls are doing to your effort score.
How to measure CES per channel
You can't fix what you don't split out. A single blended CES number hides the channel that's hurting you most. So measure it per channel, and treat the phone as its own line item.
Keep the survey to one question, sent right after the interaction:
On scale and scoring, pick the 1-7 top-box or the 1-5 average and stick with it. A "good" CES lands around 5 or higher on the 7-point scale, or 2 or lower on the 5-point one. What you're actually after isn't a perfect score this quarter, it's a number trending the right way plus a channel breakdown that tells you where to push. Fold CES into your customer service KPIs alongside first-call resolution and you'll see the phone problem the first month you run it.
How to lower phone effort without hiring a night shift
Once you can see that the phone is dragging your effort score down, the fix is obvious and the usual answer (hire more reps, stretch coverage hours) is the expensive one. The cheaper move is to stop sending repeatable calls to humans at all.
The roughly 70% of phone volume that's WISMO, returns, and product questions doesn't need a person. It needs an instant, correct answer at 8 p.m. on a Sunday. Route that off the human queue and two things happen at once: the routine caller gets a zero-effort experience, and your reps get the genuinely hard calls back, which is the work they were actually hired for. That's also the playbook in our guide to scaling customer service without hiring.
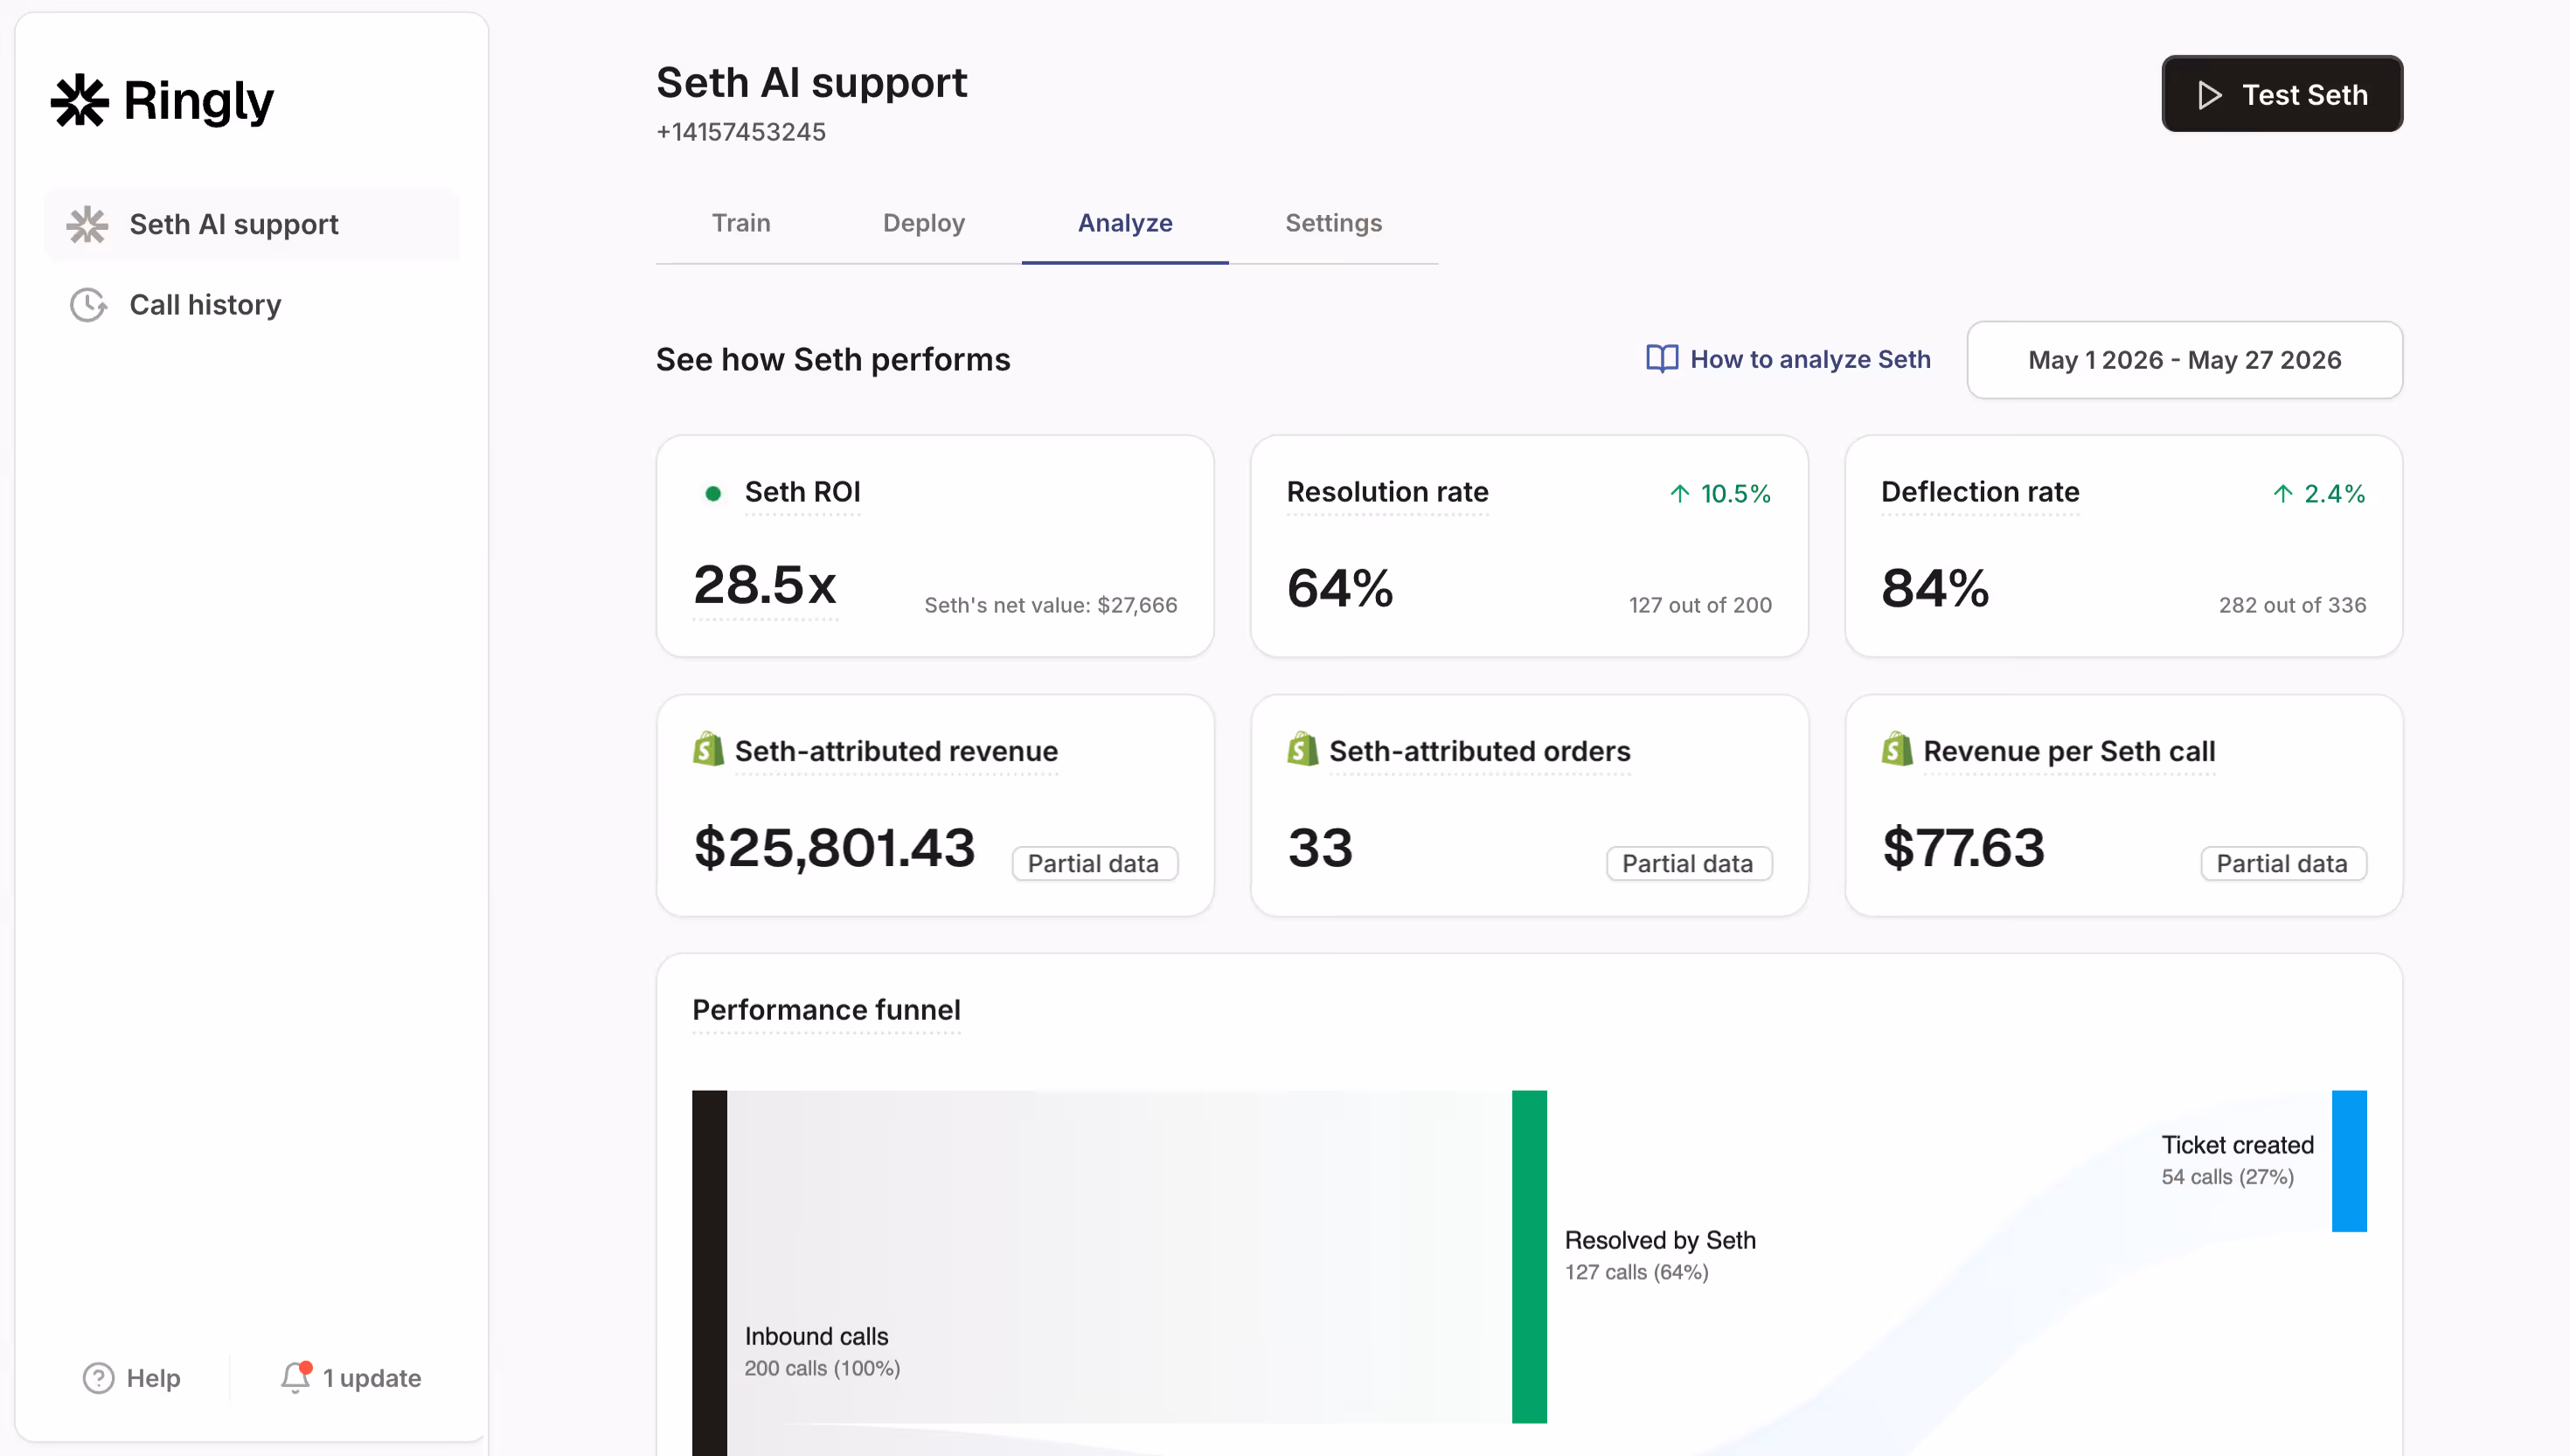
Ringly.io is AI phone support for Shopify brands. Instead of hiring and training a phone team to cover the hours nobody wants, the AI handles inbound calls 24/7: order status, returns, product questions, abandoned-cart rescue. Across 50+ brands, it resolves 73% of calls autonomously at roughly $0.42 per resolved call, and anything that needs a human escalates cleanly to Gorgias, Zendesk, Re:amaze, or whatever helpdesk you already run. Plans start at $349/mo with a 65% resolution guarantee, and you're live in under an hour.
Here's the math when you treat phone effort as a staffing problem instead of a routing one.
Line itemTodayWith Ringly6 reps × $4K loaded per rep$24,000/mon/aRingly (~$5K/mo)n/a$5,000/moNet monthly CS spend
$19,000/mo
Annual savingsn/a
$228,000/yr
That's roughly 70% of repeatable calls (order status, returns, the same five questions over and over) answered instantly. The other 30%, the genuinely complex calls, still go to your CS team, who now have the time to actually solve them. Compare it against a 24/7 ecommerce phone support desk and the effort difference is the part the savings number doesn't capture.
CES vs CSAT vs NPS: which one to track
You don't have to choose just one. But if you're deciding which metric drives your support roadmap, here's the honest breakdown.
MetricWhat it measuresThe questionScaleBest usedCESFriction / ease of a task"How easy was it to resolve your issue?"1-7 or 1-5Right after a support interactionCSATSatisfaction with one interaction"How satisfied were you with X?"1-5Right after a specific touchpointNPSLong-term loyalty / advocacy"How likely are you to recommend us?"0-10Periodic relationship survey
NPS (Bain, 2003) is your brand-health gauge and CSAT is your spot-check on a single moment. Both are worth running. But CES is the leading indicator of churn, which makes it the one that should drive what you fix next. Track all three, let CES set the priorities. When effort drops, CSAT and NPS follow on their own.
Frequently asked questions
On the 1-7 scale, a good CES sits around 5 or higher, with top performers pushing past 6. On the 1-5 scale (1 = very easy), you want an average of 2 or below. More important than the absolute number is the trend and the channel split.
Both are valid. The 1-7 "How easy was it to resolve your issue?" (CES v2.0) is the current standard; the 1-5 scale is common in ecommerce. Pick one and never switch, because the comparison over time is what you're managing.
Two common methods. Average: sum every response and divide by the count. Top-box: count responses of 5, 6, or 7, divide by total, multiply by 100 to get a percentage. Most modern tools default to top-box.
Immediately after the interaction you're measuring: ticket close for email and chat, an SMS right after a phone call, or post-delivery for fulfillment. Effort fades from memory fast, so same-day beats next-week.
For predicting loyalty and churn, yes. CES is 1.8x more predictive than CSAT and 2x more than NPS (Gartner). For brand advocacy, NPS is still the right tool. Run all three, but let CES drive your support roadmap.
Send a one-question CES survey by SMS right after the call. When you can't survey, use first-call resolution and answered-call rate as proxies. The phone is the channel where most brands have no CES data at all, which is exactly why it's worth instrumenting first.
Yes, and it's usually cheaper. Route the repeatable 70% of calls (WISMO, returns, product questions) to an AI phone agent so they're answered instantly, 24/7, and reserve your team for the complex calls. That removes the highest-effort moment (the unanswered call) without a night shift.
Talk to us

If your phone rolls to voicemail after 6 p.m., that's the highest-effort experience your store can hand someone, and it's the one your effort score never sees. A 30-min call is the fastest way to find out what those missed calls are costing you in repeat purchase.
Ruben (Ringly co-founder) takes these calls personally.